| Map | Pie | Office | Total | D | R | I | Margin | %Margin | Dem | Rep | Ind | Oth. | Dem | Rep | Ind | Other | | | | | | | | | | | | | | | | | | |
|---|
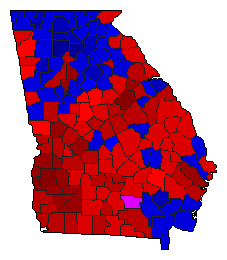
 |  | Senator |
2,031,274 |
2 |
1 |
0 |
139,231 |
6.85% |
45.89% |
52.75% |
0.00% |
1.36% |
932,237 |
1,071,468 |
0 |
27,569 |
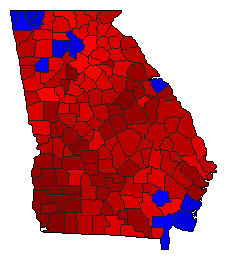
 |  | Governor |
2,028,251 |
2 |
1 |
0 |
104,549 |
5.15% |
46.20% |
51.36% |
0.00% |
2.44% |
937,153 |
1,041,702 |
0 |
49,396 |
 | | Lt. Governor |
2,006,728 |
1 |
2 |
0 |
126,941 |
6.33% |
51.89% |
45.56% |
0.00% |
2.55% |
1,041,227 |
914,286 |
0 |
51,215 |
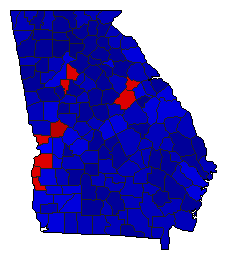
 | | Secretary of State |
2,004,840 |
1 |
2 |
0 |
507,895 |
25.33% |
61.11% |
35.78% |
0.00% |
3.11% |
1,225,232 |
717,337 |
0 |
62,271 |
 | | Attorney General |
1,968,730 |
1 |
2 |
0 |
218,738 |
11.11% |
55.56% |
44.44% |
0.00% |
0.00% |
1,093,734 |
874,996 |
0 |
0 |
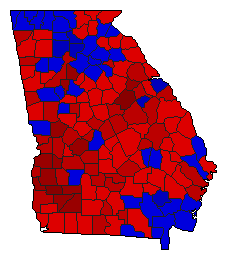
 | | Insurance Commissioner |
1,984,026 |
2 |
1 |
0 |
617,077 |
31.10% |
33.15% |
64.25% |
0.00% |
2.59% |
657,754 |
1,274,831 |
0 |
51,441 |
 | | Agriculture Commissioner |
1,983,914 |
1 |
2 |
3 |
362,181 |
18.26% |
57.40% |
39.14% |
3.46% |
0.00% |
1,138,705 |
776,524 |
68,685 |
0 |
|
