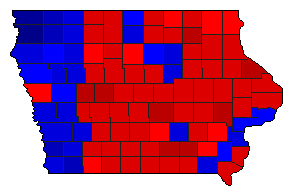
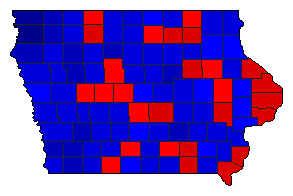
2002 General Election Results Comparison - Iowa
| Map | Pie | Office | Total | D | R | I | Margin | %Margin | Dem | Rep | Ind | Oth. | Dem | Rep | Ind | Other |
 |  | Senator | 1,023,075 | 1 | 2 | 0 | 106,386 | 10.40% | 54.18% | 43.78% | 0.00% | 2.04% | 554,278 | 447,892 | 0 | 20,905 |
 |  | Governor | 1,025,802 | 1 | 2 | 0 | 83,837 | 8.17% | 52.69% | 44.51% | 0.00% | 2.80% | 540,449 | 456,612 | 0 | 28,741 |
 | Secretary of State | 985,041 | 1 | 2 | 0 | 106,310 | 10.79% | 53.46% | 42.67% | 0.00% | 3.87% | 526,600 | 420,290 | 0 | 38,151 | |
 | State Treasurer | 976,319 | 1 | 2 | 0 | 113,140 | 11.59% | 54.77% | 43.18% | 0.00% | 2.05% | 534,714 | 421,574 | 0 | 20,031 | |
 | Attorney General | 993,663 | 1 | 2 | 0 | 247,687 | 24.93% | 61.61% | 36.68% | 0.00% | 1.71% | 612,167 | 364,480 | 0 | 17,016 | |
 | State Auditor | 956,155 | 2 | 1 | 0 | 22,429 | 2.35% | 46.23% | 48.58% | 0.00% | 5.19% | 442,040 | 464,469 | 0 | 49,646 | |
 |  | Agriculture Commissioner | 981,447 | 1 | 2 | 0 | 44,425 | 4.53% | 49.98% | 45.46% | 0.00% | 4.56% | 490,561 | 446,136 | 0 | 44,750 |
Iowa Results for 2002
Login
© Dave Leip's Atlas of U.S. Elections, LLC 2019 All Rights Reserved
Note: The advertisement links below may advocate political positions that this site does not endorse.
Login
© Dave Leip's Atlas of U.S. Elections, LLC 2019 All Rights Reserved
Note: The advertisement links below may advocate political positions that this site does not endorse.