Note: The Google advertisement links below may advocate political positions that this site does not endorse.
| Map | Pie | Office | Total | D | R | I | Margin | %Margin | Dem | Rep | Ind | Oth. | Dem | Rep | Ind | Other | | | | | | | | | | | | | | | | | | |
|---|
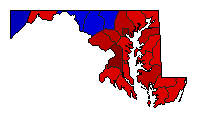
 |  | Governor |
1,706,179 |
2 |
1 |
0 |
66,170 |
3.88% |
47.68% |
51.55% |
0.00% |
0.77% |
813,422 |
879,592 |
0 |
13,165 |
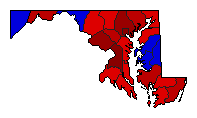
 | | Attorney General |
1,632,839 |
1 |
2 |
0 |
496,543 |
30.41% |
65.17% |
34.76% |
0.00% |
0.07% |
1,064,112 |
567,569 |
0 |
1,158 |
 | | Comptroller General |
1,656,407 |
1 |
2 |
0 |
602,494 |
36.37% |
67.93% |
31.56% |
0.00% |
0.50% |
1,125,279 |
522,785 |
0 |
8,343 |
|
