2002 General Election Results Comparison - Massachusetts
| Map | Pie | Office | Total | D | R | I | Margin | %Margin | Dem | Rep | Ind | Oth. | Dem | Rep | Ind | Other |
| Senator | 2,006,758 | 1 | 0 | 0 | 1,236,169 | 61.60% | 80.03% | 0.00% | 0.00% | 19.97% | 1,605,976 | 0 | 0 | 400,782 | ||
| Governor | 2,194,179 | 2 | 1 | 0 | 106,007 | 4.83% | 44.94% | 49.77% | 0.00% | 5.30% | 985,981 | 1,091,988 | 0 | 116,210 | ||
 | Secretary of State | 1,990,654 | 1 | 2 | 0 | 956,302 | 48.04% | 73.97% | 25.93% | 0.00% | 0.09% | 1,472,562 | 516,260 | 0 | 1,832 | |
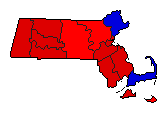 | State Treasurer | 2,053,574 | 1 | 2 | 3 | 191,377 | 9.32% | 50.66% | 41.34% | 7.96% | 0.04% | 1,040,281 | 848,904 | 163,559 | 830 | |
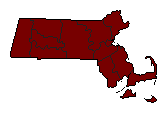 | Attorney General | 1,615,143 | 1 | 0 | 0 | 1,590,491 | 98.47% | 99.24% | 0.00% | 0.00% | 0.76% | 1,602,817 | 0 | 0 | 12,326 | |
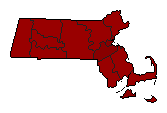 | State Auditor | 1,870,916 | 1 | 0 | 2 | 1,178,906 | 63.01% | 77.87% | 0.00% | 14.86% | 7.27% | 1,456,880 | 0 | 277,974 | 136,062 | |
| Map | Pie | Initiative | Total Vote | N | Y | Margin | %Margin | No | Yes | Oth. | No | Yes | ||||
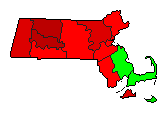 | Referendum | 2,220,301 | 1 | 0 | 2 | 184,985 | 8.33% | 48.22% | 0.00% | 39.89% | 11.89% | 1,070,668 | 0 | 885,683 | 263,950 | |
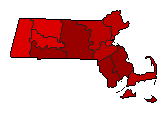 | Referendum | 2,220,301 | 1 | 0 | 2 | 945,150 | 42.57% | 65.87% | 0.00% | 23.30% | 10.84% | 1,462,435 | 0 | 517,285 | 240,581 | |
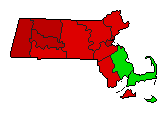 | Initiative | 1,956,351 | 1 | 0 | 2 | 184,985 | 9.46% | 54.73% | 0.00% | 45.27% | 0.00% | 1,070,668 | 0 | 885,683 | 0 | |
 | Initiative | 2,220,301 | 2 | 0 | 1 | 719,410 | 32.40% | 28.85% | 0.00% | 61.25% | 9.90% | 640,525 | 0 | 1,359,935 | 219,841 | |
Massachusetts Results for 2002
Login
© Dave Leip's Atlas of U.S. Elections, LLC 2019 All Rights Reserved
Note: The advertisement links below may advocate political positions that this site does not endorse.
Login
© Dave Leip's Atlas of U.S. Elections, LLC 2019 All Rights Reserved
Note: The advertisement links below may advocate political positions that this site does not endorse.