| Map | Pie | Office | Total | D | R | I | Margin | %Margin | Dem | Rep | Ind | Oth. | Dem | Rep | Ind | Other | | | | | | | | | | | | | | | | | | |
|---|
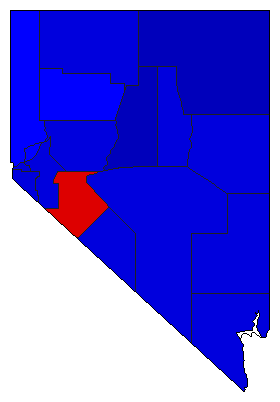
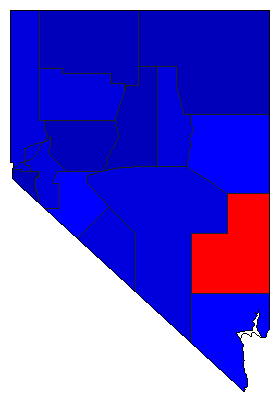
 |  | Governor |
504,079 |
2 |
1 |
0 |
233,066 |
46.24% |
22.01% |
68.24% |
0.00% |
9.75% |
110,935 |
344,001 |
0 |
49,143 |
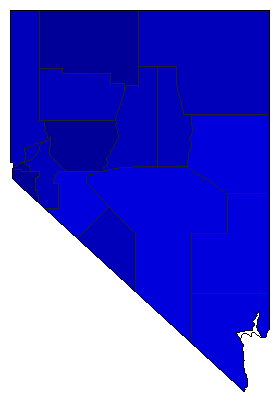
 | | Lt. Governor |
502,666 |
2 |
1 |
0 |
51,168 |
10.18% |
41.64% |
51.82% |
0.00% |
6.54% |
209,300 |
260,468 |
0 |
32,898 |
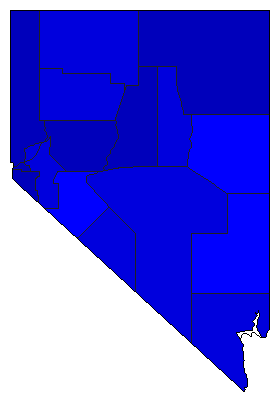
 | | Secretary of State |
492,482 |
2 |
1 |
0 |
173,470 |
35.22% |
25.31% |
60.54% |
0.00% |
14.15% |
124,655 |
298,125 |
0 |
69,702 |
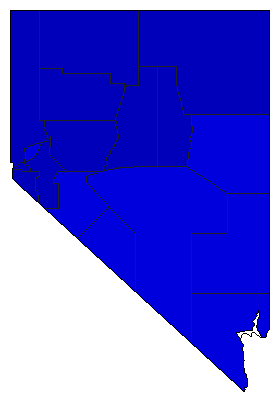
 | | State Treasurer |
489,133 |
2 |
1 |
0 |
110,263 |
22.54% |
32.94% |
55.48% |
0.00% |
11.57% |
161,130 |
271,393 |
0 |
56,610 |
 | | Attorney General |
496,781 |
2 |
1 |
0 |
122,958 |
24.75% |
33.72% |
58.47% |
0.00% |
7.81% |
167,513 |
290,471 |
0 |
38,797 |
 | | Controller |
487,072 |
2 |
1 |
0 |
83,214 |
17.08% |
35.36% |
52.44% |
0.00% |
12.20% |
172,207 |
255,421 |
0 |
59,444 |
| | | Map | Pie | Initiative | Total Vote | N | | Y | Margin | %Margin | No | | Yes | Oth. | No | | Yes | |
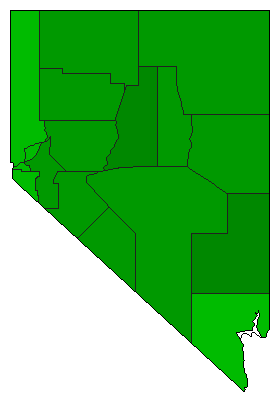 | | Initiative |
501,770 |
2 |
0 |
1 |
172,624 |
34.40% |
32.80% |
0.00% |
67.20% |
0.00% |
164,573 |
0 |
337,197 |
0 |
|
