| Map | Pie | Office | Total | D | R | I | Margin | %Margin | Dem | Rep | Ind | Oth. | Dem | Rep | Ind | Other | | | | | | | | | | | | | | | | | | |
|---|
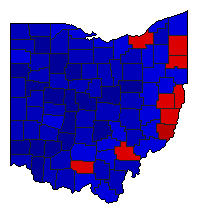
 |  | Governor |
3,228,992 |
2 |
1 |
3 |
628,083 |
19.45% |
38.31% |
57.76% |
3.92% |
0.01% |
1,236,924 |
1,865,007 |
126,686 |
375 |
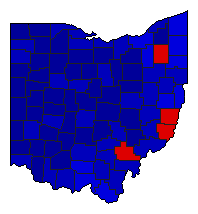
 | | Secretary of State |
3,084,423 |
2 |
1 |
0 |
571,567 |
18.53% |
40.73% |
59.27% |
0.00% |
0.00% |
1,256,428 |
1,827,995 |
0 |
0 |
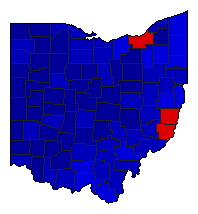
 | | State Treasurer |
3,126,065 |
2 |
1 |
0 |
207,731 |
6.65% |
46.68% |
53.32% |
0.00% |
0.00% |
1,459,113 |
1,666,844 |
0 |
108 |
 | | Attorney General |
3,130,729 |
2 |
1 |
0 |
884,093 |
28.24% |
35.88% |
64.12% |
0.00% |
0.00% |
1,123,318 |
2,007,411 |
0 |
0 |
 | | State Auditor |
3,124,979 |
2 |
1 |
0 |
895,065 |
28.64% |
35.68% |
64.32% |
0.00% |
0.00% |
1,114,957 |
2,010,022 |
0 |
0 |
|
