| Map | Pie | Office | Total | D | R | I | Margin | %Margin | Dem | Rep | Ind | Oth. | Dem | Rep | Ind | Other | | | | | | | | | | | | | | | | | | |
|---|
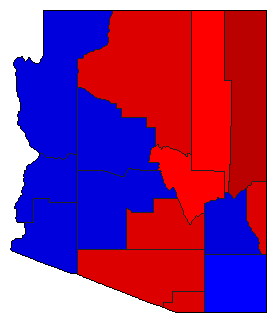
 |  | Governor |
1,226,111 |
1 |
2 |
3 |
11,819 |
0.96% |
46.19% |
45.22% |
6.93% |
1.67% |
566,284 |
554,465 |
84,947 |
20,415 |
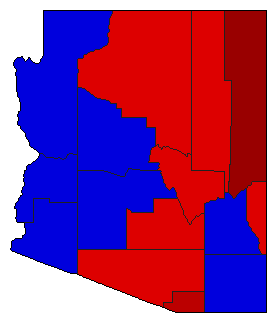
 | | Secretary of State |
1,184,562 |
2 |
1 |
0 |
37,440 |
3.16% |
46.26% |
49.42% |
0.00% |
4.31% |
548,011 |
585,451 |
0 |
51,100 |
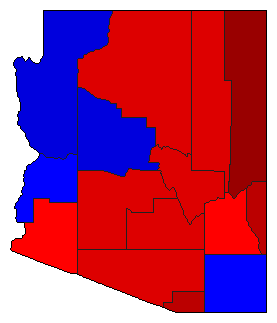
 | | State Treasurer |
1,166,129 |
2 |
1 |
0 |
28,741 |
2.46% |
48.77% |
51.23% |
0.00% |
0.00% |
568,694 |
597,435 |
0 |
0 |
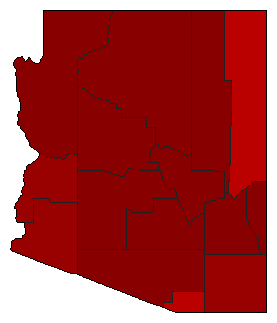
 | | Attorney General |
1,201,343 |
1 |
2 |
0 |
82,491 |
6.87% |
51.87% |
45.00% |
0.00% |
3.13% |
623,135 |
540,644 |
0 |
37,564 |
| | | Map | Pie | Initiative | Total Vote | N | | Y | Margin | %Margin | No | | Yes | Oth. | No | | Yes | |
 |  | Initiative |
1,168,812 |
1 |
0 |
2 |
822,560 |
70.38% |
85.19% |
0.00% |
14.81% |
0.00% |
995,686 |
0 |
173,126 |
0 |
 |  | Initiative |
1,182,276 |
1 |
0 |
2 |
712,406 |
60.26% |
80.13% |
0.00% |
19.87% |
0.00% |
947,341 |
0 |
234,935 |
0 |
 |  | Initiative |
1,200,964 |
2 |
0 |
1 |
20,836 |
1.73% |
49.13% |
0.00% |
50.87% |
0.00% |
590,064 |
0 |
610,900 |
0 |
 |  | Initiative |
1,183,053 |
1 |
0 |
2 |
173,839 |
14.69% |
57.35% |
0.00% |
42.65% |
0.00% |
678,446 |
0 |
504,607 |
0 |
|
