| Map | Pie | Office | Total | D | R | I | Margin | %Margin | Dem | Rep | Ind | Oth. | Dem | Rep | Ind | Other | | | | | | | | | | | | | | | | | | |
|---|
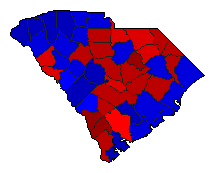
 |  | Senator |
1,102,948 |
2 |
1 |
0 |
112,651 |
10.21% |
44.19% |
54.40% |
0.00% |
1.41% |
487,359 |
600,010 |
0 |
15,579 |
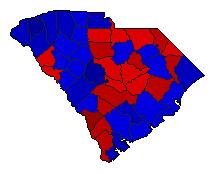
 |  | Governor |
1,107,725 |
2 |
1 |
0 |
64,282 |
5.80% |
47.05% |
52.85% |
0.00% |
0.10% |
521,140 |
585,422 |
0 |
1,163 |
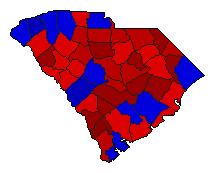
 | | Lt. Governor |
1,088,066 |
2 |
1 |
0 |
75,303 |
6.92% |
45.81% |
52.73% |
0.00% |
1.46% |
498,431 |
573,734 |
0 |
15,901 |
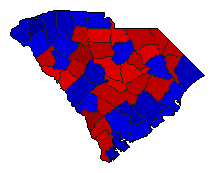
 | | Secretary of State |
1,074,591 |
2 |
1 |
0 |
147,298 |
13.71% |
43.13% |
56.84% |
0.00% |
0.03% |
463,501 |
610,799 |
0 |
291 |
 | | State Treasurer |
1,078,794 |
1 |
2 |
0 |
48,426 |
4.49% |
52.23% |
47.74% |
0.00% |
0.02% |
563,478 |
515,052 |
0 |
264 |
 | | Attorney General |
1,084,989 |
2 |
1 |
0 |
119,371 |
11.00% |
44.48% |
55.48% |
0.00% |
0.05% |
482,560 |
601,931 |
0 |
498 |
 | | Comptroller General |
1,069,110 |
2 |
1 |
0 |
97,331 |
9.10% |
45.43% |
54.54% |
0.00% |
0.03% |
485,748 |
583,079 |
0 |
283 |
 |  | Agriculture Commissioner |
1,063,070 |
2 |
1 |
0 |
11,573 |
1.09% |
49.44% |
50.53% |
0.00% |
0.03% |
525,595 |
537,168 |
0 |
307 |
|
