2002 General Election Results Comparison - Texas
| Map | Pie | Office | Total | D | R | I | Margin | %Margin | Dem | Rep | Ind | Oth. | Dem | Rep | Ind | Other |
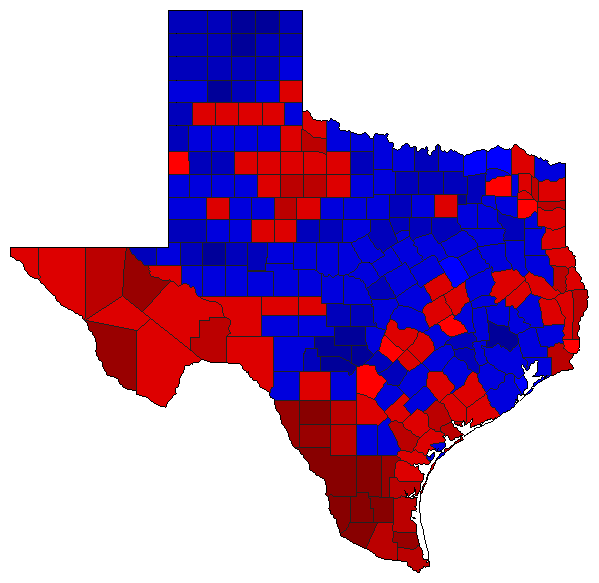
 |  | Senator | 4,514,012 | 2 | 1 | 0 | 540,485 | 11.97% | 43.33% | 55.30% | 0.00% | 1.37% | 1,955,758 | 2,496,243 | 0 | 62,011 |
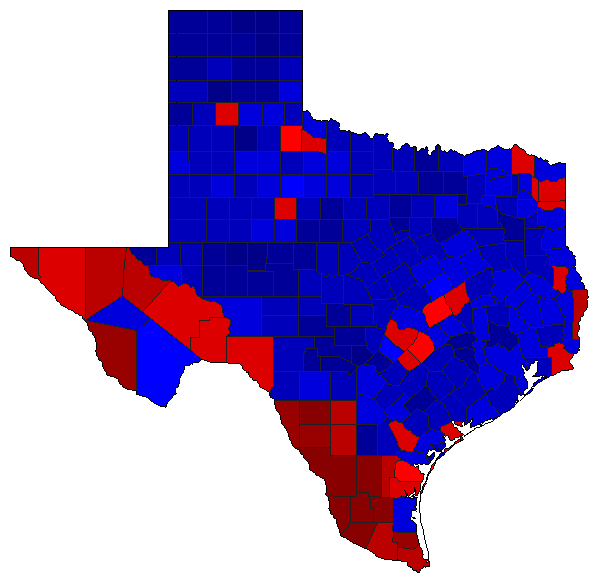
 |  | Governor | 4,553,979 | 2 | 1 | 0 | 812,698 | 17.85% | 39.96% | 57.81% | 0.00% | 2.23% | 1,819,843 | 2,632,541 | 0 | 101,595 |
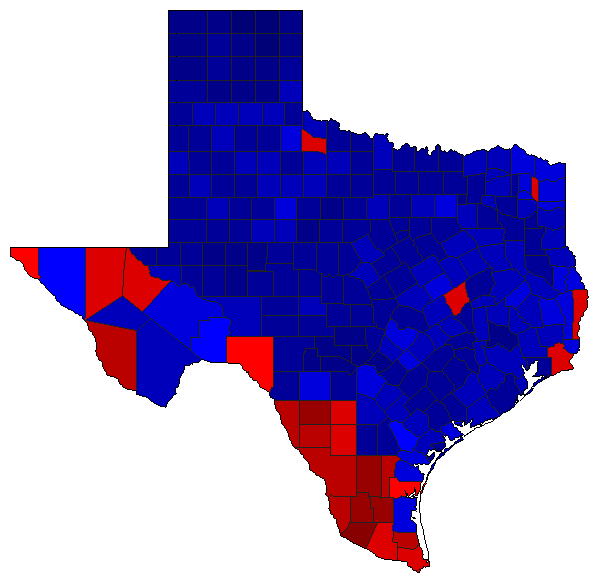
 | Lt. Governor | 4,523,427 | 2 | 1 | 0 | 259,594 | 5.74% | 46.03% | 51.77% | 0.00% | 2.19% | 2,082,281 | 2,341,875 | 0 | 99,271 | |
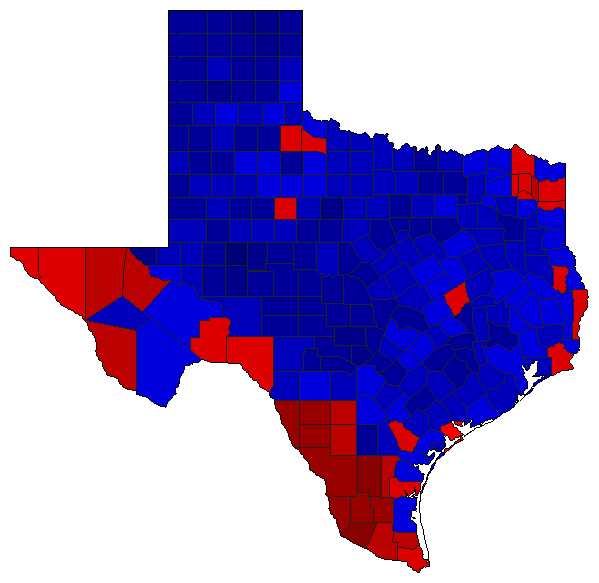
 | Attorney General | 4,481,983 | 2 | 1 | 0 | 700,825 | 15.64% | 41.08% | 56.72% | 0.00% | 2.20% | 1,841,359 | 2,542,184 | 0 | 98,440 | |
 | Comptroller General | 4,486,499 | 2 | 1 | 0 | 1,401,756 | 31.24% | 32.92% | 64.16% | 0.00% | 2.92% | 1,476,976 | 2,878,732 | 0 | 130,791 | |
 | Agriculture Commissioner | 4,427,553 | 2 | 1 | 4 | 961,757 | 21.72% | 37.82% | 59.54% | 1.18% | 1.46% | 1,674,372 | 2,636,129 | 52,234 | 64,818 |
Texas Results for 2002
Login
© Dave Leip's Atlas of U.S. Elections, LLC 2019 All Rights Reserved
Note: The advertisement links below may advocate political positions that this site does not endorse.
Login
© Dave Leip's Atlas of U.S. Elections, LLC 2019 All Rights Reserved
Note: The advertisement links below may advocate political positions that this site does not endorse.