| Map | Pie | Office | Total | D | R | I | Margin | %Margin | Dem | Rep | Ind | Oth. | Dem | Rep | Ind | Other | | | | | | | | | | | | | | | | | | |
|---|
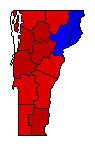
 |  | Governor |
230,161 |
2 |
1 |
3 |
5,871 |
2.55% |
42.39% |
44.94% |
9.71% |
2.96% |
97,565 |
103,436 |
22,353 |
6,807 |
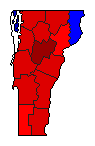
 | | Lt. Governor |
228,419 |
2 |
1 |
3 |
20,543 |
8.99% |
32.18% |
41.17% |
24.76% |
1.89% |
73,501 |
94,044 |
56,564 |
4,310 |
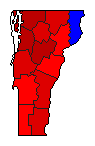
 | | Secretary of State |
223,621 |
1 |
2 |
0 |
48,564 |
21.72% |
58.79% |
37.07% |
0.00% |
4.14% |
131,469 |
82,905 |
0 |
9,247 |
 | | State Treasurer |
222,798 |
1 |
2 |
0 |
47,230 |
21.20% |
57.21% |
36.01% |
0.00% |
6.78% |
127,459 |
80,229 |
0 |
15,110 |
 | | Attorney General |
221,679 |
1 |
2 |
0 |
58,135 |
26.22% |
56.61% |
30.39% |
0.00% |
13.00% |
125,495 |
67,360 |
0 |
28,824 |
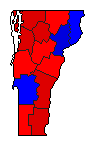 | | State Auditor |
220,655 |
1 |
2 |
0 |
19,898 |
9.02% |
51.32% |
42.30% |
0.00% |
6.38% |
113,240 |
93,342 |
0 |
14,073 |
|
