| Map | Pie | Year | Total | D | R | I | Margin | %Margin | Dem | Rep | Ind | Oth. | Dem | Rep | Ind | Other | | | | | | | | | | | | | | | | | | |
|---|
 | | 2010 |
2,269,652 |
2 |
0 |
1 |
91,452 |
4.03% |
47.99% |
0.00% |
52.01% |
0.00% |
1,089,100 |
0 |
1,180,552 |
0 |
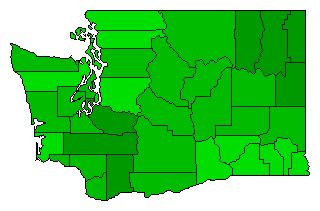
 | | 2002 |
1,632,661 |
1 |
0 |
2 |
301,141 |
18.44% |
59.22% |
0.00% |
40.78% |
0.00% |
966,901 |
0 |
665,760 |
0 |
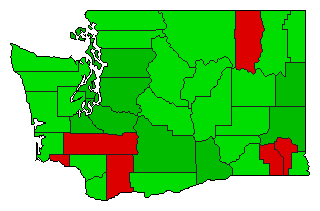
 | | 1995 |
1,326,516 |
2 |
0 |
1 |
291,650 |
21.99% |
39.01% |
0.00% |
60.99% |
0.00% |
517,433 |
0 |
809,083 |
0 |
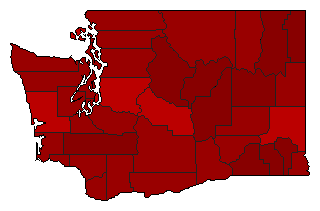
 | | 1980 |
1,522,778 |
2 |
0 |
1 |
406,122 |
26.67% |
36.67% |
0.00% |
63.33% |
0.00% |
558,328 |
0 |
964,450 |
0 |
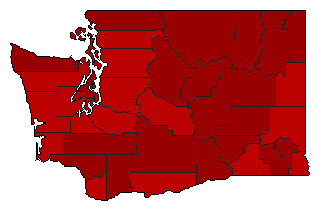
 | | 1977 |
924,723 |
1 |
0 |
2 |
405,201 |
43.82% |
71.91% |
0.00% |
28.09% |
0.00% |
664,962 |
0 |
259,761 |
0 |
 | | 1973 |
900,669 |
1 |
0 |
2 |
318,023 |
35.31% |
67.65% |
0.00% |
32.35% |
0.00% |
609,346 |
0 |
291,323 |
0 |
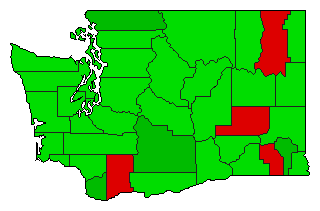 | | 1972 |
1,269,664 |
2 |
0 |
1 |
119,952 |
9.45% |
45.28% |
0.00% |
54.72% |
0.00% |
574,856 |
0 |
694,808 |
0 |
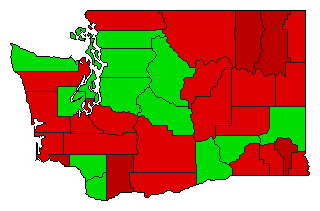 | | 1970 |
994,710 |
2 |
0 |
1 |
45,614 |
4.59% |
47.71% |
0.00% |
52.29% |
0.00% |
474,548 |
0 |
520,162 |
0 |
|


