Note: The Google advertisement links below may advocate political positions that this site does not endorse.
| Map | Pie | Year | Total | D | R | I | Margin | %Margin | Dem | Rep | Ind | Oth. | Dem | Rep | Ind | Other | | | | | | | | | | | | | | | | | | |
|---|
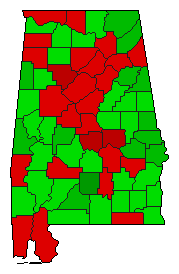
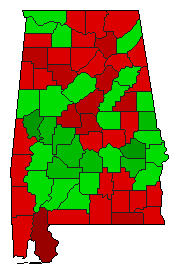 | | 2010 |
1,158,882 |
1 |
0 |
2 |
53,832 |
4.65% |
52.32% |
0.00% |
47.68% |
0.00% |
606,357 |
0 |
552,525 |
0 |
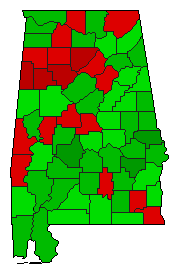 | | 2006 |
995,891 |
2 |
0 |
1 |
170,999 |
17.17% |
41.41% |
0.00% |
58.59% |
0.00% |
412,446 |
0 |
583,445 |
0 |
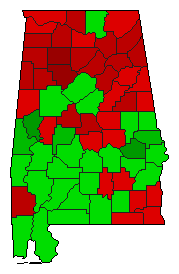 | | 2004 |
1,378,906 |
1 |
0 |
2 |
1,846 |
0.13% |
50.07% |
0.00% |
49.93% |
0.00% |
690,376 |
0 |
688,530 |
0 |
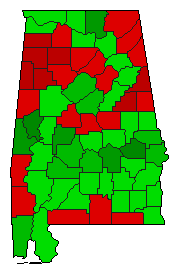 | | 2000 |
1,347,658 |
2 |
0 |
1 |
255,792 |
18.98% |
40.51% |
0.00% |
59.49% |
0.00% |
545,933 |
0 |
801,725 |
0 |
 | | 1996 |
1,128,544 |
1 |
0 |
2 |
7,126 |
0.63% |
50.32% |
0.00% |
49.68% |
0.00% |
567,835 |
0 |
560,709 |
0 |
|
