2004 General Election Results Comparison - Michigan
| Map | Pie | Office | Total | D | R | I | Margin | %Margin | Dem | Rep | Ind | Oth. | Dem | Rep | Ind | Other |
 |  | President | 4,839,252 | 1 | 2 | - | 165,437 | 3.42% | 51.23% | 47.81% | 0.00% | 0.96% | 2,479,183 | 2,313,746 | 0 | 46,323 |
| Map | Pie | Initiative | Total Vote | N | Y | Margin | %Margin | No | Yes | Oth. | No | Yes | ||||
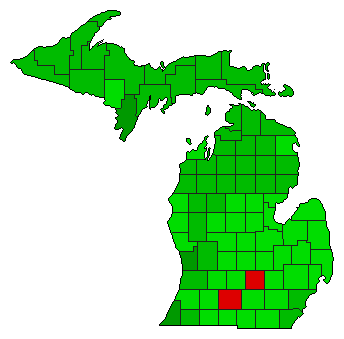 | Referendum | 4,616,169 | 2 | 0 | 1 | 762,727 | 16.52% | 41.74% | 0.00% | 58.26% | 0.00% | 1,926,721 | 0 | 2,689,448 | 0 | |
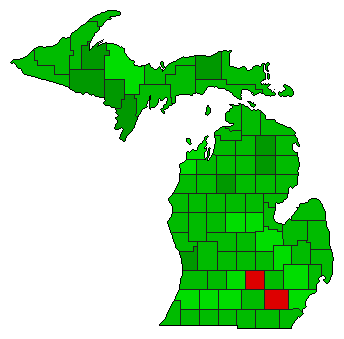 | Referendum | 4,602,396 | 2 | 0 | 1 | 793,758 | 17.25% | 41.38% | 0.00% | 58.62% | 0.00% | 1,904,319 | 0 | 2,698,077 | 0 | |
Michigan Results for 2004
Login
© Dave Leip's Atlas of U.S. Elections, LLC 2019 All Rights Reserved
Note: The advertisement links below may advocate political positions that this site does not endorse.
Login
© Dave Leip's Atlas of U.S. Elections, LLC 2019 All Rights Reserved
Note: The advertisement links below may advocate political positions that this site does not endorse.