| Map | Pie | Office | Total | D | R | I | Margin | %Margin | Dem | Rep | Ind | Oth. | Dem | Rep | Ind | Other | | | | | | | | | | | | | | | | | | |
|---|
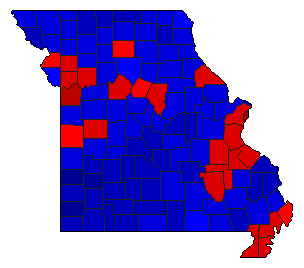
 |  | President |
2,731,364 |
2 |
1 |
- |
196,542 |
7.20% |
46.10% |
53.30% |
0.00% |
0.60% |
1,259,171 |
1,455,713 |
0 |
16,480 |
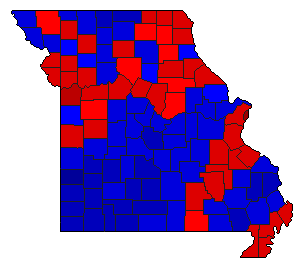
 |  | Senator |
2,706,402 |
2 |
1 |
0 |
359,828 |
13.30% |
42.80% |
56.09% |
0.00% |
1.11% |
1,158,261 |
1,518,089 |
0 |
30,052 |
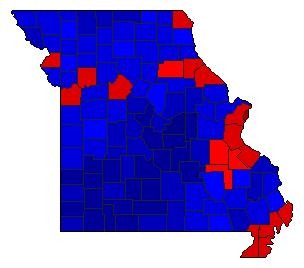
 |  | Governor |
2,719,599 |
2 |
1 |
0 |
80,977 |
2.98% |
47.85% |
50.83% |
0.00% |
1.31% |
1,301,442 |
1,382,419 |
0 |
35,738 |
 | | Lt. Governor |
2,656,109 |
2 |
1 |
0 |
13,814 |
0.52% |
48.43% |
48.95% |
0.00% |
2.62% |
1,286,295 |
1,300,109 |
0 |
69,705 |
 | | Secretary of State |
2,678,326 |
1 |
2 |
0 |
124,780 |
4.66% |
51.07% |
46.41% |
0.00% |
2.52% |
1,367,783 |
1,243,003 |
0 |
67,540 |
 | | State Treasurer |
2,632,812 |
2 |
1 |
0 |
128,280 |
4.87% |
46.10% |
50.97% |
0.00% |
2.92% |
1,213,769 |
1,342,049 |
0 |
76,994 |
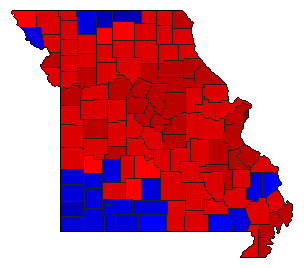 | | Attorney General |
2,656,685 |
1 |
2 |
0 |
592,339 |
22.30% |
59.96% |
37.66% |
0.00% |
2.38% |
1,592,842 |
1,000,503 |
0 |
63,340 |
| | | Map | Pie | Initiative | Total Vote | N | | Y | Margin | %Margin | No | | Yes | Oth. | No | | Yes | |
 | | Referendum |
2,200,079 |
2 |
0 |
1 |
541,571 |
24.62% |
37.69% |
0.00% |
62.31% |
0.00% |
829,254 |
0 |
1,370,825 |
0 |
|
