| Map | Pie | Year | Total | D | R | I | Margin | %Margin | Dem | Rep | Ind | Oth. | Dem | Rep | Ind | Other | | | | | | | | | | | | | | | | | | |
|---|
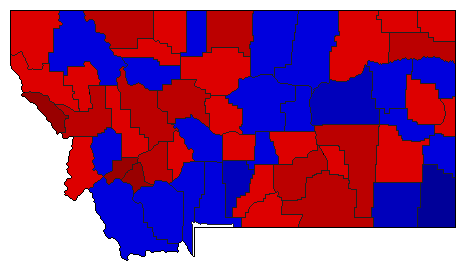
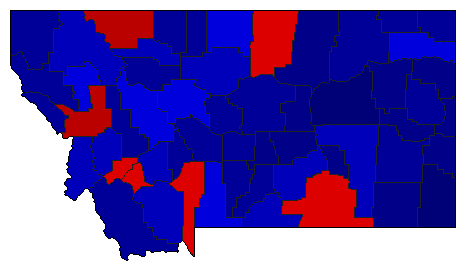 |  | 2020 |
595,347 |
2 |
1 |
0 |
101,297 |
17.01% |
41.49% |
58.51% |
0.00% |
0.00% |
247,025 |
348,322 |
0 |
0 |
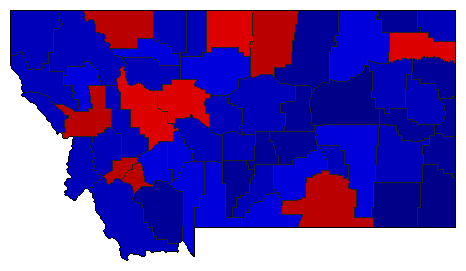
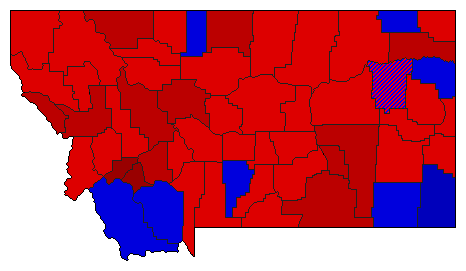
 |  | 2016 |
491,733 |
2 |
1 |
0 |
173,795 |
35.34% |
32.33% |
67.67% |
0.00% |
0.00% |
158,969 |
332,764 |
0 |
0 |
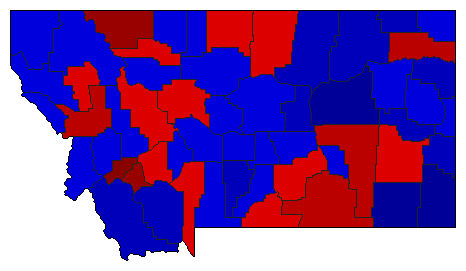
 | | 2012 |
466,485 |
2 |
1 |
0 |
35,667 |
7.65% |
46.18% |
53.82% |
0.00% |
0.00% |
215,409 |
251,076 |
0 |
0 |
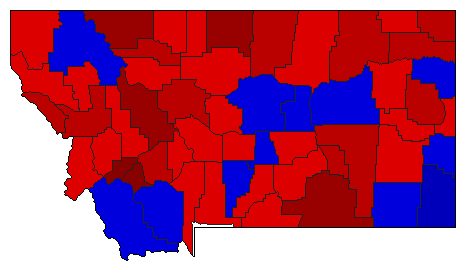
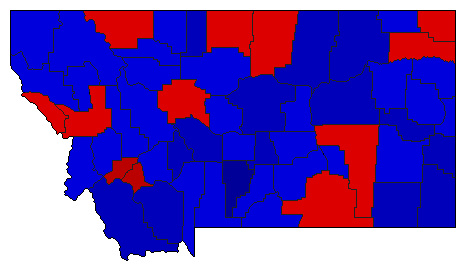
 | | 2008 |
464,111 |
1 |
2 |
0 |
23,193 |
5.00% |
52.50% |
47.50% |
0.00% |
0.00% |
243,652 |
220,459 |
0 |
0 |
 |  | 2004 |
344,548 |
1 |
0 |
0 |
344,548 |
100.00% |
100.00% |
0.00% |
0.00% |
0.00% |
344,548 |
0 |
0 |
0 |
 | | 2000 |
398,025 |
1 |
2 |
0 |
25,427 |
6.39% |
53.19% |
46.81% |
0.00% |
0.00% |
211,726 |
186,299 |
0 |
0 |
 | | 1996 |
391,120 |
1 |
2 |
0 |
82,618 |
21.12% |
60.56% |
39.44% |
0.00% |
0.00% |
236,869 |
154,251 |
0 |
0 |
 | | 1992 |
390,677 |
1 |
2 |
0 |
61,289 |
15.69% |
57.84% |
42.16% |
0.00% |
0.00% |
225,983 |
164,694 |
0 |
0 |
 |  | 1988 |
360,712 |
2 |
1 |
0 |
16,938 |
4.70% |
47.65% |
52.35% |
0.00% |
0.00% |
171,887 |
188,825 |
0 |
0 |
 |  | 1984 |
367,184 |
1 |
2 |
0 |
72,865 |
19.84% |
58.19% |
38.35% |
0.00% |
3.47% |
213,663 |
140,798 |
0 |
12,723 |
 |  | 1932 |
199,903 |
1 |
2 |
3 |
16,994 |
8.50% |
53.13% |
44.63% |
2.23% |
0.00% |
106,215 |
89,221 |
4,467 |
0 |
 |  | 1928 |
180,079 |
2 |
1 |
3 |
13,444 |
7.47% |
46.04% |
53.51% |
0.45% |
0.00% |
82,914 |
96,358 |
807 |
0 |
|
