| Map | Pie | Office | Total | D | R | I | Margin | %Margin | Dem | Rep | Ind | Oth. | Dem | Rep | Ind | Other | | | | | | | | | | | | | | | | | | |
|---|
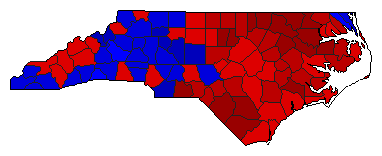
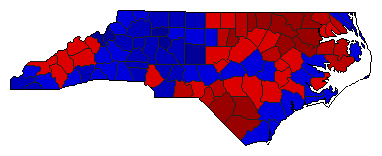
 |  | President |
3,501,007 |
2 |
1 |
- |
435,317 |
12.43% |
43.58% |
56.02% |
0.00% |
0.40% |
1,525,849 |
1,961,166 |
0 |
13,992 |
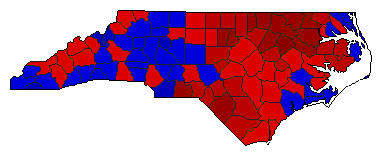
 |  | Senator |
3,472,082 |
2 |
1 |
0 |
158,923 |
4.58% |
47.02% |
51.60% |
0.00% |
1.39% |
1,632,527 |
1,791,450 |
0 |
48,105 |
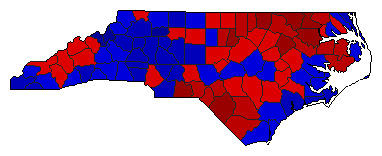
 |  | Governor |
3,486,688 |
1 |
2 |
0 |
444,133 |
12.74% |
55.62% |
42.88% |
0.00% |
1.51% |
1,939,154 |
1,495,021 |
0 |
52,513 |
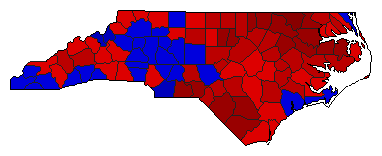
 | | Lt. Governor |
3,398,470 |
1 |
2 |
3 |
434,692 |
12.79% |
55.57% |
42.78% |
1.66% |
0.00% |
1,888,397 |
1,453,705 |
56,368 |
0 |
 | | Secretary of State |
3,334,694 |
1 |
2 |
0 |
488,476 |
14.65% |
57.32% |
42.68% |
0.00% |
0.00% |
1,911,585 |
1,423,109 |
0 |
0 |
 | | State Treasurer |
3,324,820 |
1 |
2 |
0 |
299,582 |
9.01% |
54.51% |
45.49% |
0.00% |
0.00% |
1,812,201 |
1,512,619 |
0 |
0 |
 | | Attorney General |
3,366,218 |
1 |
2 |
0 |
377,976 |
11.23% |
55.61% |
44.39% |
0.00% |
0.00% |
1,872,097 |
1,494,121 |
0 |
0 |
 | | State Auditor |
3,295,993 |
2 |
1 |
0 |
28,715 |
0.87% |
49.56% |
50.44% |
0.00% |
0.00% |
1,633,639 |
1,662,354 |
0 |
0 |
 | | Insurance Commissioner |
3,355,474 |
1 |
2 |
0 |
512,678 |
15.28% |
57.64% |
42.36% |
0.00% |
0.00% |
1,934,076 |
1,421,398 |
0 |
0 |
 |  | Agriculture Commissioner |
3,330,107 |
2 |
1 |
0 |
2,287 |
0.07% |
49.97% |
50.03% |
0.00% |
0.00% |
1,663,910 |
1,666,197 |
0 |
0 |
|
