2004 General Election Results Comparison - Arizona
| Map | Pie | Office | Total | D | R | I | Margin | %Margin | Dem | Rep | Ind | Oth. | Dem | Rep | Ind | Other |
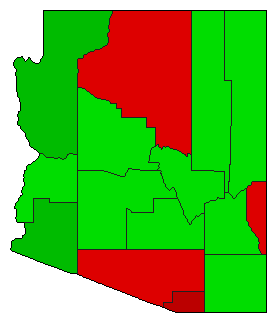
 |  | President | 2,016,102 | 2 | 1 | - | 210,770 | 10.45% | 44.32% | 54.77% | 0.00% | 0.91% | 893,524 | 1,104,294 | 0 | 18,284 |
 |  | Senator | 1,961,677 | 2 | 1 | 0 | 1,100,865 | 56.12% | 20.62% | 76.74% | 0.00% | 2.64% | 404,507 | 1,505,372 | 0 | 51,798 |
| Map | Pie | Initiative | Total Vote | N | Y | Margin | %Margin | No | Yes | Oth. | No | Yes | ||||
 |  | Initiative | 1,872,208 | 2 | 0 | 1 | 211,274 | 11.28% | 44.36% | 0.00% | 55.64% | 0.00% | 830,467 | 0 | 1,041,741 | 0 |
Arizona Results for 2004
Login
© Dave Leip's Atlas of U.S. Elections, LLC 2019 All Rights Reserved
Note: The advertisement links below may advocate political positions that this site does not endorse.
Login
© Dave Leip's Atlas of U.S. Elections, LLC 2019 All Rights Reserved
Note: The advertisement links below may advocate political positions that this site does not endorse.