| Map | Pie | Office | Total | D | R | I | Margin | %Margin | Dem | Rep | Ind | Oth. | Dem | Rep | Ind | Other | | | | | | | | | | | | | | | | | | |
|---|
 |  | President |
1,836,782 |
1 |
2 |
- |
76,332 |
4.16% |
51.35% |
47.19% |
0.00% |
1.46% |
943,163 |
866,831 |
0 |
26,788 |
 |  | Senator |
1,780,550 |
1 |
2 |
0 |
563,474 |
31.65% |
63.39% |
31.75% |
0.00% |
4.86% |
1,128,728 |
565,254 |
0 |
86,568 |
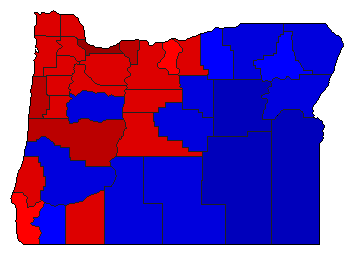 | | Secretary of State |
1,752,829 |
1 |
2 |
0 |
311,824 |
17.79% |
57.17% |
39.38% |
0.00% |
3.45% |
1,002,052 |
690,228 |
0 |
60,549 |
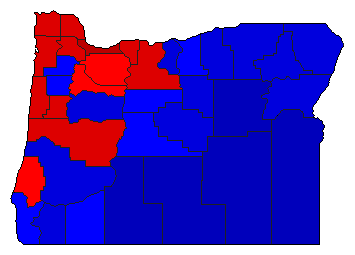 | | State Treasurer |
1,683,503 |
1 |
2 |
0 |
201,423 |
11.96% |
52.86% |
40.90% |
0.00% |
6.24% |
889,974 |
688,551 |
0 |
104,978 |
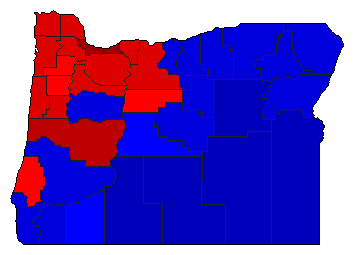 | | Attorney General |
1,707,998 |
1 |
2 |
0 |
245,565 |
14.38% |
54.78% |
40.40% |
0.00% |
4.82% |
935,621 |
690,056 |
0 |
82,321 |
| | | Map | Pie | Initiative | Total Vote | N | | Y | Margin | %Margin | No | | Yes | Oth. | No | | Yes | |
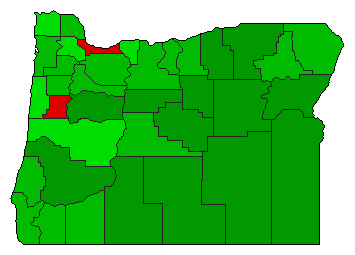 | | Initiative |
1,816,102 |
2 |
0 |
1 |
240,990 |
13.27% |
43.37% |
0.00% |
56.63% |
0.00% |
787,556 |
0 |
1,028,546 |
0 |
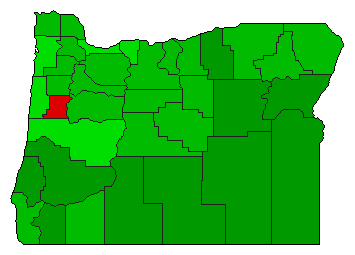 | | Initiative |
1,739,668 |
2 |
0 |
1 |
369,510 |
21.24% |
39.38% |
0.00% |
60.62% |
0.00% |
685,079 |
0 |
1,054,589 |
0 |
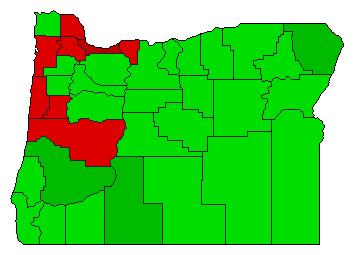 | | Initiative |
1,765,911 |
1 |
0 |
2 |
27,803 |
1.57% |
50.79% |
0.00% |
49.21% |
0.00% |
896,857 |
0 |
869,054 |
0 |
|