2004 General Election Results Comparison - Pennsylvania
| Map | Pie | Office | Total | D | R | I | Margin | %Margin | Dem | Rep | Ind | Oth. | Dem | Rep | Ind | Other |
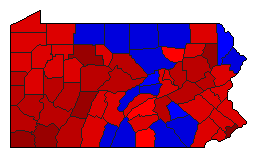
 |  | President | 5,769,590 | 1 | 2 | - | 144,248 | 2.50% | 50.92% | 48.42% | 0.00% | 0.65% | 2,938,095 | 2,793,847 | 0 | 37,648 |
 |  | Senator | 5,559,105 | 2 | 1 | 0 | 590,954 | 10.63% | 41.99% | 52.62% | 0.00% | 5.39% | 2,334,126 | 2,925,080 | 0 | 299,899 |
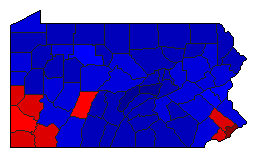
 | State Treasurer | 5,473,824 | 1 | 2 | 0 | 1,355,538 | 24.76% | 61.26% | 36.50% | 0.00% | 2.24% | 3,353,489 | 1,997,951 | 0 | 122,384 | |
 | Attorney General | 5,423,269 | 2 | 1 | 0 | 108,791 | 2.01% | 48.35% | 50.35% | 0.00% | 1.30% | 2,621,927 | 2,730,718 | 0 | 70,624 | |
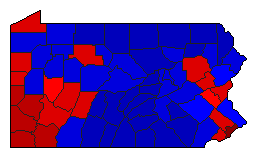 | State Auditor | 5,352,918 | 1 | 2 | 0 | 356,261 | 6.66% | 52.06% | 45.41% | 0.00% | 2.53% | 2,786,909 | 2,430,648 | 0 | 135,361 |
Pennsylvania Results for 2004
Login
© Dave Leip's Atlas of U.S. Elections, LLC 2019 All Rights Reserved
Note: The advertisement links below may advocate political positions that this site does not endorse.
Login
© Dave Leip's Atlas of U.S. Elections, LLC 2019 All Rights Reserved
Note: The advertisement links below may advocate political positions that this site does not endorse.