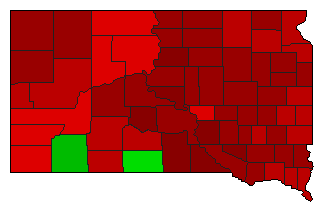
2004 General Election Results Comparison - South Dakota
| Map | Pie | Office | Total | D | R | I | Margin | %Margin | Dem | Rep | Ind | Oth. | Dem | Rep | Ind | Other |
 |  | President | 388,215 | 2 | 1 | - | 83,340 | 21.47% | 38.44% | 59.91% | 0.00% | 1.65% | 149,244 | 232,584 | 0 | 6,387 |
 |  | Senator | 391,188 | 2 | 1 | 0 | 4,508 | 1.15% | 49.42% | 50.58% | 0.00% | 0.00% | 193,340 | 197,848 | 0 | 0 |
| Map | Pie | Initiative | Total Vote | N | Y | Margin | %Margin | No | Yes | Oth. | No | Yes | ||||
 | Initiative | 379,065 | 1 | 0 | 2 | 132,645 | 34.99% | 67.50% | 0.00% | 32.50% | 0.00% | 255,855 | 0 | 123,210 | 0 | |
South Dakota Results for 2004
Login
© Dave Leip's Atlas of U.S. Elections, LLC 2019 All Rights Reserved
Note: The advertisement links below may advocate political positions that this site does not endorse.
Login
© Dave Leip's Atlas of U.S. Elections, LLC 2019 All Rights Reserved
Note: The advertisement links below may advocate political positions that this site does not endorse.