| Map | Pie | Year | Total | D | R | I | Margin | %Margin | Dem | Rep | Ind | Oth. | Dem | Rep | Ind | Other | | | | | | | | | | | | | | | | | | |
|---|
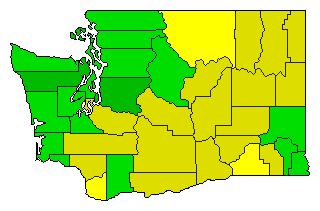 |  | 2020 |
3,582,965 |
0 |
0 |
1 |
345,722 |
9.65% |
0.00% |
0.00% |
54.57% |
45.43% |
0 |
0 |
1,955,365 |
1,627,600 |
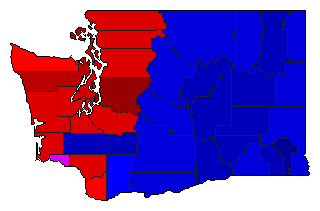 |  | 2012 |
3,125,516 |
1 |
2 |
3 |
484,272 |
15.49% |
57.07% |
41.58% |
1.35% |
0.00% |
1,783,793 |
1,299,521 |
42,202 |
0 |
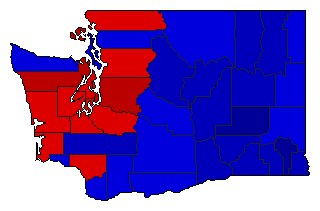 | | 2004 |
2,859,084 |
1 |
2 |
3 |
205,307 |
7.18% |
52.82% |
45.64% |
0.81% |
0.72% |
1,510,201 |
1,304,894 |
23,283 |
20,706 |
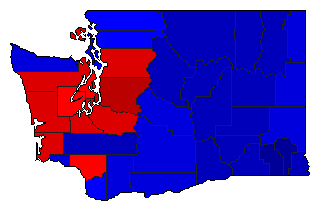 | | 2000 |
2,487,433 |
1 |
2 |
3 |
138,788 |
5.58% |
50.16% |
44.58% |
4.14% |
1.12% |
1,247,652 |
1,108,864 |
103,002 |
27,915 |
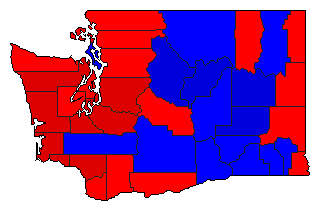 | | 1996 |
2,253,837 |
1 |
2 |
3 |
282,611 |
12.54% |
49.84% |
37.30% |
8.92% |
3.94% |
1,123,323 |
840,712 |
201,003 |
88,799 |
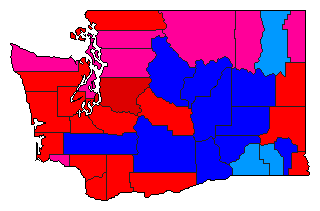 | | 1992 |
2,287,565 |
1 |
2 |
3 |
261,803 |
11.44% |
43.41% |
31.97% |
23.68% |
0.94% |
993,037 |
731,234 |
541,780 |
21,514 |
|


