| Map | Pie | Office | Total | D | R | I | Margin | %Margin | Dem | Rep | Ind | Oth. | Dem | Rep | Ind | Other | | | | | | | | | | | | | | | | | | |
|---|
 |  | President |
755,887 |
2 |
1 |
- |
97,237 |
12.86% |
43.20% |
56.06% |
0.00% |
0.74% |
326,541 |
423,778 |
0 |
5,568 |
 |  | Governor |
744,433 |
1 |
2 |
0 |
219,627 |
29.50% |
63.51% |
34.00% |
0.00% |
2.49% |
472,758 |
253,131 |
0 |
18,544 |
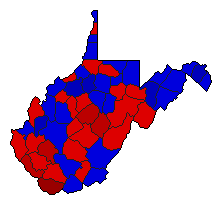 | | Secretary of State |
722,804 |
2 |
1 |
0 |
27,244 |
3.77% |
48.12% |
51.88% |
0.00% |
0.00% |
347,780 |
375,024 |
0 |
0 |
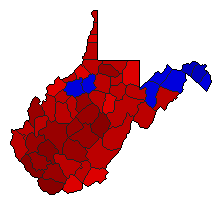 | | State Treasurer |
688,275 |
1 |
2 |
0 |
178,183 |
25.89% |
62.94% |
37.06% |
0.00% |
0.00% |
433,229 |
255,046 |
0 |
0 |
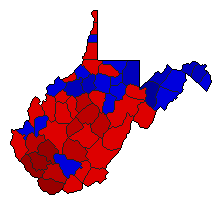 | | Attorney General |
713,036 |
1 |
2 |
0 |
5,946 |
0.83% |
50.42% |
49.58% |
0.00% |
0.00% |
359,491 |
353,545 |
0 |
0 |
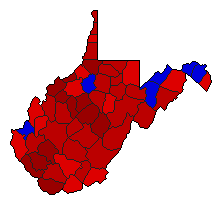 | | State Auditor |
695,821 |
1 |
2 |
0 |
160,533 |
23.07% |
61.54% |
38.46% |
0.00% |
0.00% |
428,177 |
267,644 |
0 |
0 |
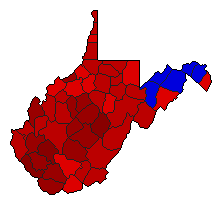 | | Agriculture Commissioner |
691,283 |
1 |
2 |
0 |
184,479 |
26.69% |
63.34% |
36.66% |
0.00% |
0.00% |
437,881 |
253,402 |
0 |
0 |
|


