| Map | Pie | Year | Total | D | R | I | Margin | %Margin | Dem | Rep | Ind | Oth. | Dem | Rep | Ind | Other | | | | | | | | | | | | | | | | | | |
|---|
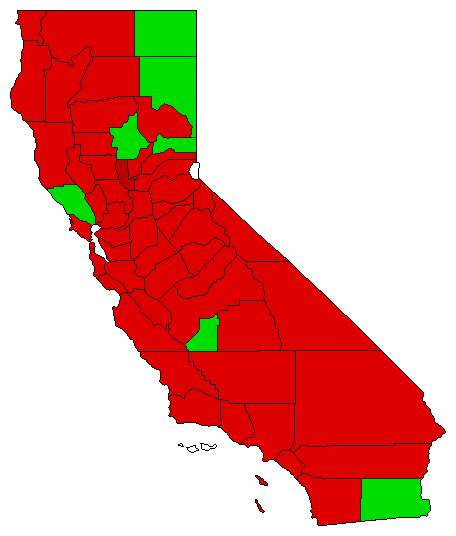
 |  | 2020 |
16,721,923 |
2 |
0 |
1 |
369,713 |
2.21% |
48.89% |
0.00% |
51.11% |
0.00% |
8,176,105 |
0 |
8,545,818 |
0 |
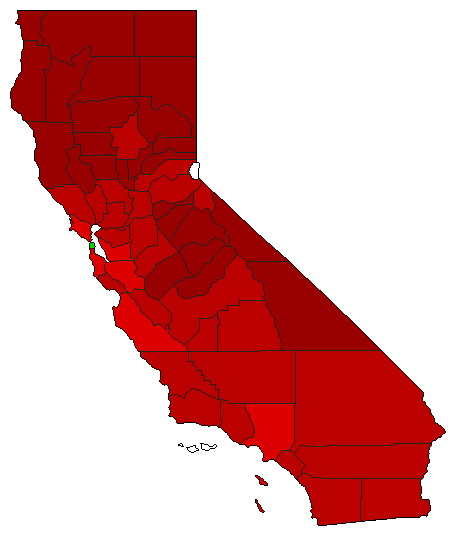
 |  | 2016 |
13,169,464 |
1 |
0 |
2 |
151,646 |
1.15% |
50.58% |
0.00% |
49.42% |
0.00% |
6,660,555 |
0 |
6,508,909 |
0 |
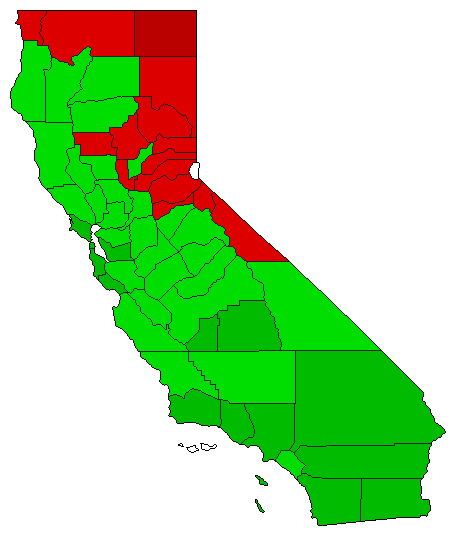
 | | 2008 |
12,948,951 |
1 |
0 |
2 |
508,005 |
3.92% |
51.96% |
0.00% |
48.04% |
0.00% |
6,728,478 |
0 |
6,220,473 |
0 |
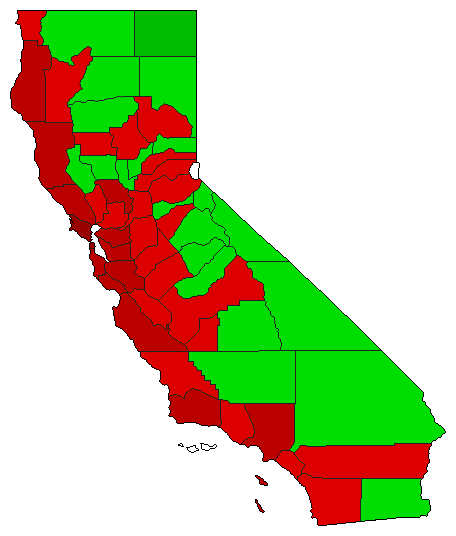
 | | 2006 |
8,410,397 |
2 |
0 |
1 |
3,443,203 |
40.94% |
29.53% |
0.00% |
70.47% |
0.00% |
2,483,597 |
0 |
5,926,800 |
0 |
 | | 2004 |
11,087,925 |
1 |
0 |
2 |
849,615 |
7.66% |
53.83% |
0.00% |
46.17% |
0.00% |
5,968,770 |
0 |
5,119,155 |
0 |
 | | 2002 |
6,830,451 |
1 |
0 |
2 |
1,063,983 |
15.58% |
57.79% |
0.00% |
42.21% |
0.00% |
3,947,217 |
0 |
2,883,234 |
0 |
 | | 2000 |
9,782,780 |
1 |
0 |
2 |
2,164,692 |
22.13% |
61.06% |
0.00% |
38.94% |
0.00% |
5,973,736 |
0 |
3,809,044 |
0 |
 | | 1998 |
8,163,868 |
2 |
0 |
1 |
2,021,024 |
24.76% |
37.62% |
0.00% |
62.38% |
0.00% |
3,071,422 |
0 |
5,092,446 |
0 |
 |  | 1978 |
6,792,413 |
1 |
0 |
2 |
1,145,827 |
16.87% |
58.43% |
0.00% |
41.57% |
0.00% |
3,969,120 |
0 |
2,823,293 |
0 |
|
