Note: The Google advertisement links below may advocate political positions that this site does not endorse.
| Map | Pie | Office | Total | D | R | I | Margin | %Margin | Dem | Rep | Ind | Oth. | Dem | Rep | Ind | Other | | | | | | | | | | | | | | | | | | |
|---|
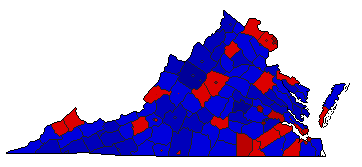
 |  | Governor |
1,983,778 |
1 |
2 |
3 |
113,615 |
5.73% |
51.72% |
45.99% |
2.22% |
0.08% |
1,025,942 |
912,327 |
43,953 |
1,556 |
 | | Lt. Governor |
1,940,236 |
2 |
1 |
0 |
22,359 |
1.15% |
49.32% |
50.47% |
0.00% |
0.21% |
956,906 |
979,265 |
0 |
4,065 |
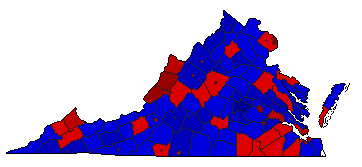 | | Attorney General |
1,943,250 |
2 |
1 |
0 |
323 |
0.02% |
49.95% |
49.96% |
0.00% |
0.09% |
970,563 |
970,886 |
0 |
1,801 |
|
