| Map | Pie | Office | Total | D | R | I | Margin | %Margin | Dem | Rep | Ind | Oth. | Dem | Rep | Ind | Other | | | | | | | | | | | | | | | | | | |
|---|
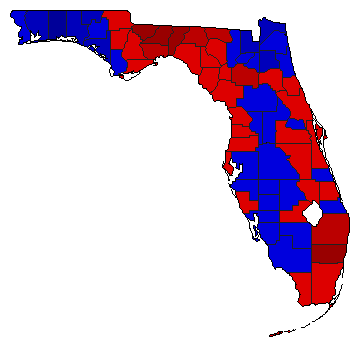
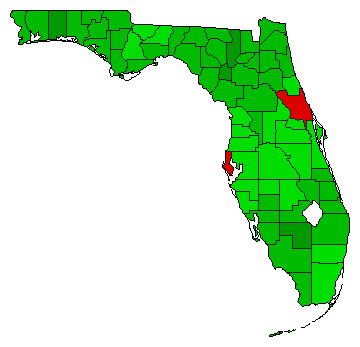
 |  | Senator |
4,793,534 |
1 |
2 |
0 |
1,064,421 |
22.21% |
60.30% |
38.10% |
0.00% |
1.60% |
2,890,548 |
1,826,127 |
0 |
76,859 |
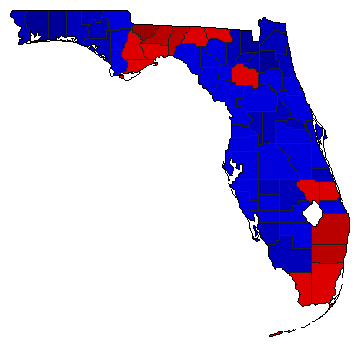
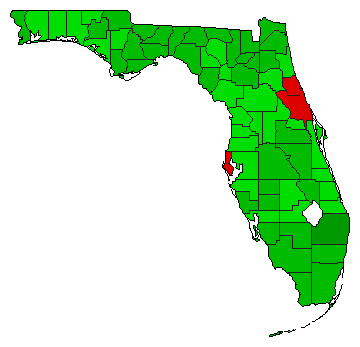
 |  | Governor |
4,829,270 |
2 |
1 |
0 |
341,556 |
7.07% |
45.11% |
52.18% |
0.00% |
2.72% |
2,178,289 |
2,519,845 |
0 |
131,136 |
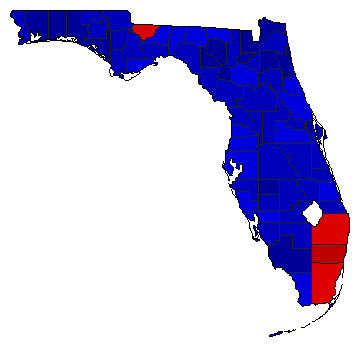
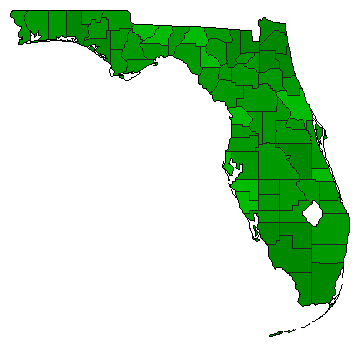
 | | State Treasurer |
4,631,093 |
1 |
2 |
0 |
328,629 |
7.10% |
53.55% |
46.45% |
0.00% |
0.00% |
2,479,861 |
2,151,232 |
0 |
0 |
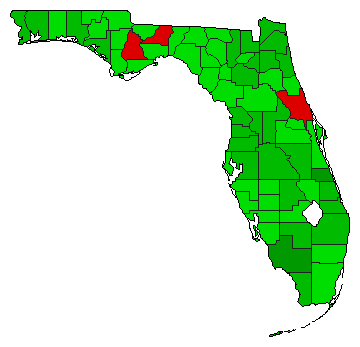
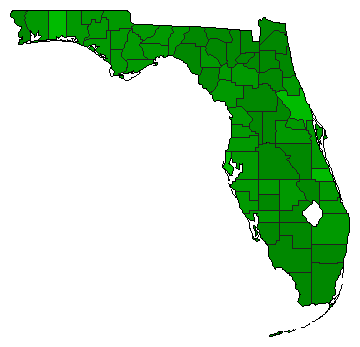
 | | Attorney General |
4,645,967 |
2 |
1 |
0 |
250,049 |
5.38% |
47.31% |
52.69% |
0.00% |
0.00% |
2,197,959 |
2,448,008 |
0 |
0 |
 |  | Agriculture Commissioner |
4,654,297 |
2 |
1 |
0 |
649,369 |
13.95% |
43.02% |
56.98% |
0.00% |
0.00% |
2,002,464 |
2,651,833 |
0 |
0 |
| | | Map | Pie | Initiative | Total Vote | N | | Y | Margin | %Margin | No | | Yes | Oth. | No | | Yes | |
 | | Referendum |
4,295,303 |
2 |
0 |
1 |
845,569 |
19.69% |
40.16% |
0.00% |
59.84% |
0.00% |
1,724,867 |
0 |
2,570,436 |
0 |
 | | Referendum |
4,501,328 |
2 |
0 |
1 |
700,610 |
15.56% |
42.22% |
0.00% |
57.78% |
0.00% |
1,900,359 |
0 |
2,600,969 |
0 |
 | | Referendum |
4,574,165 |
2 |
0 |
1 |
999,705 |
21.86% |
39.07% |
0.00% |
60.93% |
0.00% |
1,787,230 |
0 |
2,786,935 |
0 |
 | | Referendum |
4,625,229 |
2 |
0 |
1 |
2,440,973 |
52.78% |
23.61% |
0.00% |
76.39% |
0.00% |
1,092,128 |
0 |
3,533,101 |
0 |
 | | Referendum |
4,564,399 |
2 |
0 |
1 |
2,540,483 |
55.66% |
22.17% |
0.00% |
77.83% |
0.00% |
1,011,958 |
0 |
3,552,441 |
0 |
 | | Referendum |
4,413,370 |
2 |
0 |
1 |
1,681,470 |
38.10% |
30.95% |
0.00% |
69.05% |
0.00% |
1,365,950 |
0 |
3,047,420 |
0 |
|
