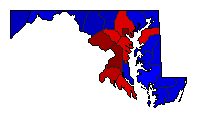
| Map | Pie | Office | Total | D | R | I | Margin | %Margin | Dem | Rep | Ind | Oth. | Dem | Rep | Ind | Other | | | | | | | | | | | | | | | | | | |
|---|
 |  | Senator |
1,781,139 |
1 |
2 |
0 |
178,295 |
10.01% |
54.21% |
44.20% |
0.00% |
1.60% |
965,477 |
787,182 |
0 |
28,480 |
 |  | Governor |
1,788,316 |
1 |
2 |
0 |
116,815 |
6.53% |
52.69% |
46.16% |
0.00% |
1.15% |
942,279 |
825,464 |
0 |
20,573 |
 | | Attorney General |
1,710,839 |
1 |
2 |
0 |
378,025 |
22.10% |
60.99% |
38.90% |
0.00% |
0.11% |
1,043,458 |
665,433 |
0 |
1,948 |
 | | Comptroller General |
1,723,998 |
1 |
2 |
0 |
312,803 |
18.14% |
58.97% |
40.83% |
0.00% |
0.20% |
1,016,677 |
703,874 |
0 |
3,447 |
|