2006 General Election Results Comparison - Minnesota
| Map | Pie | Office | Total | D | R | I | Margin | %Margin | Dem | Rep | Ind | Oth. | Dem | Rep | Ind | Other |
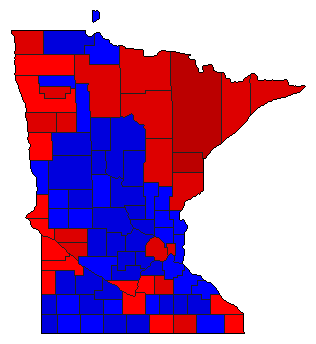
 |  | Senator | 2,202,772 | 1 | 2 | 3 | 443,196 | 20.12% | 58.06% | 37.94% | 3.23% | 0.78% | 1,278,849 | 835,653 | 71,194 | 17,076 |
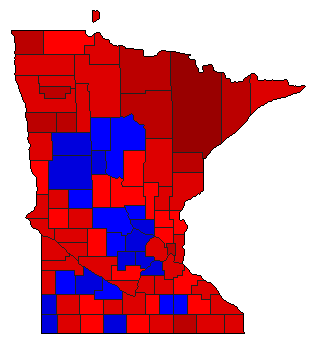
 |  | Governor | 2,202,937 | 2 | 1 | 3 | 21,108 | 0.96% | 45.73% | 46.69% | 6.43% | 1.14% | 1,007,460 | 1,028,568 | 141,735 | 25,174 |
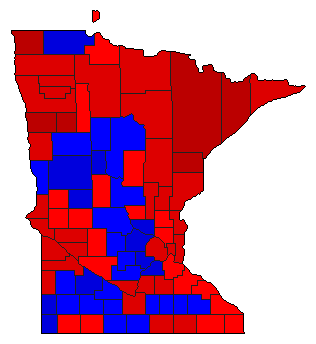
 | Secretary of State | 2,137,643 | 1 | 2 | 3 | 105,443 | 4.93% | 49.09% | 44.16% | 3.67% | 3.07% | 1,049,432 | 943,989 | 78,522 | 65,700 | |
 | Attorney General | 2,125,209 | 1 | 2 | 3 | 266,009 | 12.52% | 53.24% | 40.72% | 4.05% | 1.99% | 1,131,474 | 865,465 | 86,032 | 42,238 | |
 | State Auditor | 2,109,005 | 1 | 2 | 3 | 229,400 | 10.88% | 51.94% | 41.06% | 4.60% | 2.39% | 1,095,441 | 866,041 | 97,076 | 50,447 | |
| Map | Pie | Initiative | Total Vote | N | Y | Margin | %Margin | No | Yes | Oth. | No | Yes | ||||
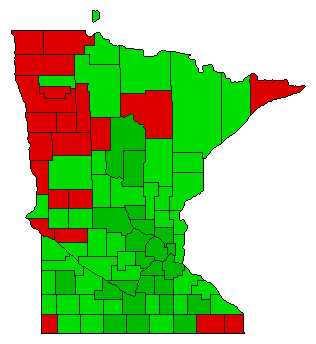 |  | Amendment | 2,108,238 | 2 | 0 | 1 | 431,846 | 20.48% | 39.76% | 0.00% | 60.24% | 0.00% | 838,196 | 0 | 1,270,042 | 0 |
Minnesota Results for 2006
Login
© Dave Leip's Atlas of U.S. Elections, LLC 2019 All Rights Reserved
Note: The advertisement links below may advocate political positions that this site does not endorse.
Login
© Dave Leip's Atlas of U.S. Elections, LLC 2019 All Rights Reserved
Note: The advertisement links below may advocate political positions that this site does not endorse.