| Map | Pie | Office | Total | D | R | I | Margin | %Margin | Dem | Rep | Ind | Oth. | Dem | Rep | Ind | Other | | | | | | | | | | | | | | | | | | |
|---|
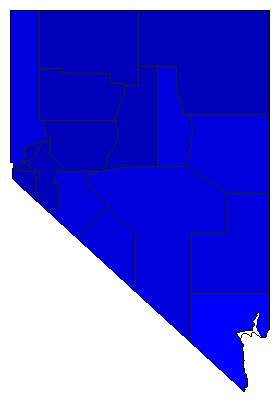
 |  | Senator |
582,572 |
2 |
1 |
0 |
83,705 |
14.37% |
40.99% |
55.36% |
0.00% |
3.65% |
238,796 |
322,501 |
0 |
21,275 |
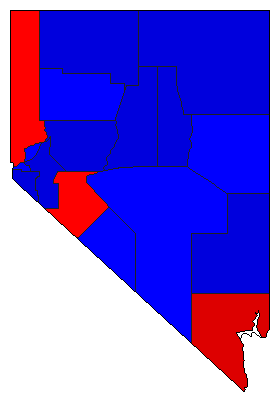
 |  | Governor |
582,158 |
2 |
1 |
0 |
23,319 |
4.01% |
43.92% |
47.93% |
0.00% |
8.15% |
255,684 |
279,003 |
0 |
47,471 |
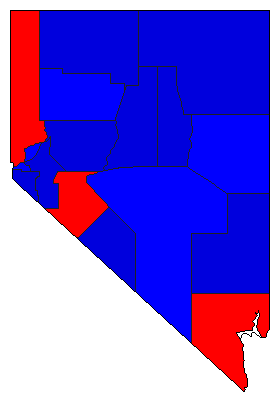
 | | Lt. Governor |
576,716 |
2 |
1 |
0 |
72,737 |
12.61% |
39.62% |
52.24% |
0.00% |
8.14% |
228,521 |
301,258 |
0 |
46,937 |
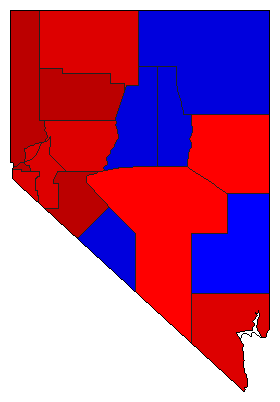
 | | Secretary of State |
573,638 |
1 |
2 |
0 |
46,805 |
8.16% |
48.73% |
40.57% |
0.00% |
10.71% |
279,510 |
232,705 |
0 |
61,423 |
 | | State Treasurer |
573,589 |
1 |
2 |
0 |
32,016 |
5.58% |
47.26% |
41.68% |
0.00% |
11.06% |
271,088 |
239,072 |
0 |
63,429 |
 | | Attorney General |
574,975 |
1 |
2 |
0 |
134,649 |
23.42% |
59.04% |
35.62% |
0.00% |
5.34% |
339,465 |
204,816 |
0 |
30,694 |
 | | Controller |
570,791 |
1 |
2 |
0 |
6,935 |
1.21% |
45.16% |
43.95% |
0.00% |
10.89% |
257,790 |
250,855 |
0 |
62,146 |
| | | Map | Pie | Initiative | Total Vote | N | | Y | Margin | %Margin | No | | Yes | Oth. | No | | Yes | |
 | | Initiative |
575,452 |
2 |
0 |
1 |
215,282 |
37.41% |
31.29% |
0.00% |
68.71% |
0.00% |
180,085 |
0 |
395,367 |
0 |
 | | Initiative |
575,638 |
1 |
0 |
2 |
68,188 |
11.85% |
55.92% |
0.00% |
44.08% |
0.00% |
321,913 |
0 |
253,725 |
0 |
|
