2006 General Election Results Comparison - New Mexico
| Map | Pie | Office | Total | D | R | I | Margin | %Margin | Dem | Rep | Ind | Oth. | Dem | Rep | Ind | Other |
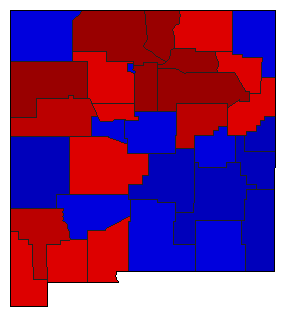
 |  | Senator | 558,550 | 1 | 2 | 0 | 230,539 | 41.27% | 70.61% | 29.33% | 0.00% | 0.06% | 394,365 | 163,826 | 0 | 359 |
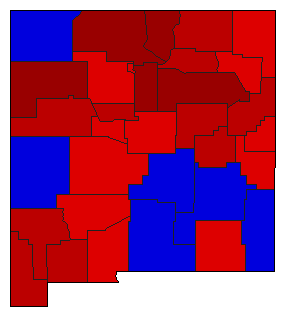
 |  | Governor | 559,170 | 1 | 2 | 0 | 210,442 | 37.63% | 68.82% | 31.18% | 0.00% | 0.00% | 384,806 | 174,364 | 0 | 0 |
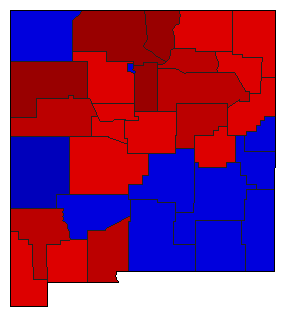
 |  | Secretary of State | 556,610 | 1 | 2 | 0 | 47,114 | 8.46% | 54.23% | 45.77% | 0.00% | 0.00% | 301,862 | 254,748 | 0 | 0 |
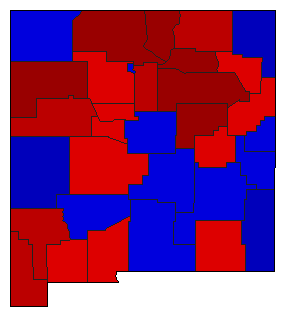
 | State Treasurer | 548,944 | 1 | 2 | 0 | 116,146 | 21.16% | 60.58% | 39.42% | 0.00% | 0.00% | 332,545 | 216,399 | 0 | 0 | |
 |  | Attorney General | 559,715 | 1 | 2 | 0 | 76,285 | 13.63% | 56.81% | 43.19% | 0.00% | 0.00% | 318,000 | 241,715 | 0 | 0 |
 | State Auditor | 544,368 | 1 | 2 | 0 | 51,918 | 9.54% | 54.77% | 45.23% | 0.00% | 0.00% | 298,143 | 246,225 | 0 | 0 |
New Mexico Results for 2006
Login
© Dave Leip's Atlas of U.S. Elections, LLC 2019 All Rights Reserved
Note: The advertisement links below may advocate political positions that this site does not endorse.
Login
© Dave Leip's Atlas of U.S. Elections, LLC 2019 All Rights Reserved
Note: The advertisement links below may advocate political positions that this site does not endorse.