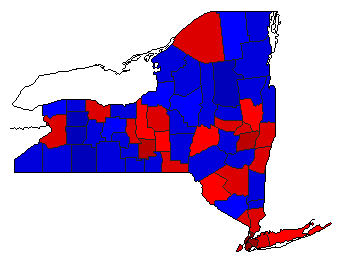
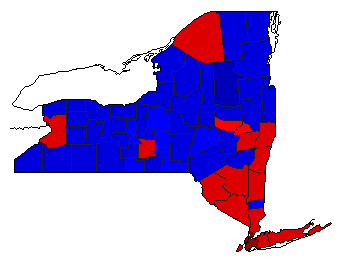
| Map | Pie | Office | Total | D | R | I | Margin | %Margin | Dem | Rep | Ind | Oth. | Dem | Rep | Ind | Other | | | | | | | | | | | | | | | | | | |
|---|
 |  | Senator |
4,490,053 |
1 |
2 |
0 |
1,616,239 |
36.00% |
67.00% |
31.01% |
0.00% |
1.99% |
3,008,428 |
1,392,189 |
0 |
89,436 |
 |  | Governor |
4,437,220 |
1 |
2 |
0 |
1,812,374 |
40.84% |
69.56% |
28.72% |
0.00% |
1.72% |
3,086,709 |
1,274,335 |
0 |
76,176 |
 | | Attorney General |
4,303,350 |
1 |
2 |
3 |
816,731 |
18.98% |
58.31% |
39.33% |
1.44% |
0.92% |
2,509,311 |
1,692,580 |
61,849 |
39,610 |
 | | Comptroller General |
4,134,973 |
1 |
2 |
0 |
737,308 |
17.83% |
56.82% |
38.99% |
0.00% |
4.19% |
2,349,578 |
1,612,270 |
0 |
173,125 |
|