| Map | Pie | Office | Total | D | R | I | Margin | %Margin | Dem | Rep | Ind | Oth. | Dem | Rep | Ind | Other | | | | | | | | | | | | | | | | | | |
|---|
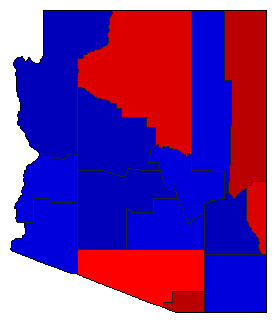
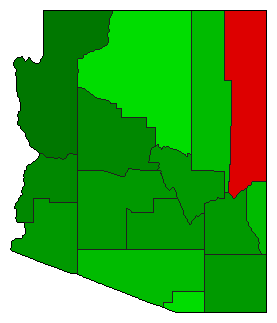
 |  | Senator |
1,526,782 |
2 |
1 |
0 |
150,257 |
9.84% |
43.50% |
53.34% |
0.00% |
3.16% |
664,141 |
814,398 |
0 |
48,243 |
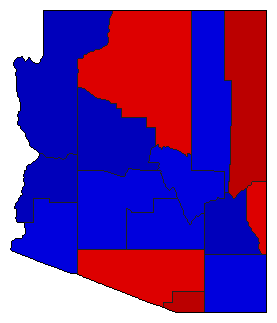
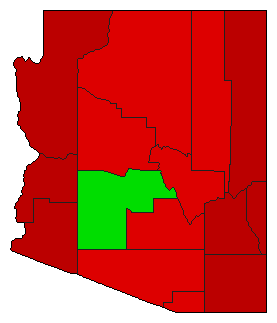
 |  | Governor |
1,533,645 |
1 |
2 |
0 |
416,302 |
27.14% |
62.58% |
35.44% |
0.00% |
1.97% |
959,830 |
543,528 |
0 |
30,287 |
 | | Secretary of State |
1,483,168 |
2 |
1 |
0 |
264,748 |
17.85% |
39.35% |
57.20% |
0.00% |
3.45% |
583,646 |
848,394 |
0 |
51,128 |
 | | State Treasurer |
1,448,328 |
2 |
1 |
0 |
193,948 |
13.39% |
43.30% |
56.70% |
0.00% |
0.00% |
627,190 |
821,138 |
0 |
0 |
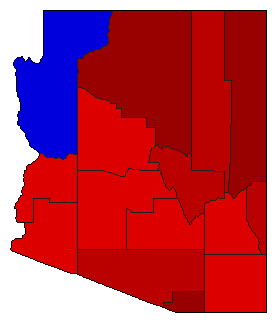 | | Attorney General |
1,494,324 |
1 |
2 |
0 |
303,690 |
20.32% |
60.16% |
39.84% |
0.00% |
0.00% |
899,007 |
595,317 |
0 |
0 |
| | | Map | Pie | Initiative | Total Vote | N | | Y | Margin | %Margin | No | | Yes | Oth. | No | | Yes | |
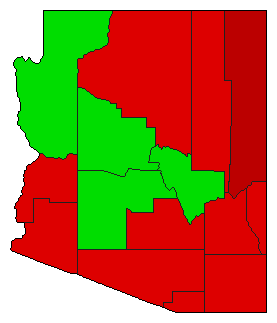
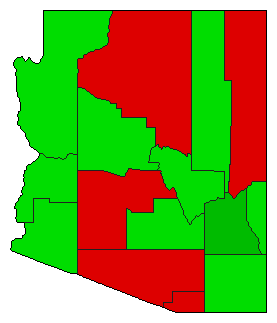 | | Referendum |
1,496,987 |
1 |
0 |
2 |
54,009 |
3.61% |
51.80% |
0.00% |
48.20% |
0.00% |
775,498 |
0 |
721,489 |
0 |
 | | Referendum |
1,505,770 |
2 |
0 |
1 |
722,776 |
48.00% |
26.00% |
0.00% |
74.00% |
0.00% |
391,497 |
0 |
1,114,273 |
0 |
 | | Referendum |
1,482,789 |
1 |
0 |
2 |
67,067 |
4.52% |
52.26% |
0.00% |
47.74% |
0.00% |
774,928 |
0 |
707,861 |
0 |
 | | Referendum |
1,451,323 |
2 |
0 |
1 |
21,015 |
1.45% |
49.28% |
0.00% |
50.72% |
0.00% |
715,154 |
0 |
736,169 |
0 |
|
