| Map | Pie | Office | Total | D | R | I | Margin | %Margin | Dem | Rep | Ind | Oth. | Dem | Rep | Ind | Other | | | | | | | | | | | | | | | | | | |
|---|
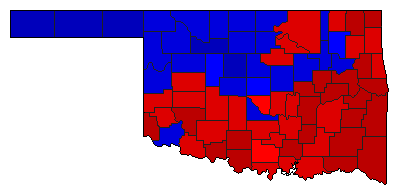
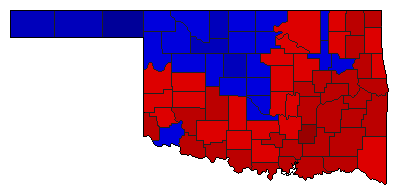
 |  | Governor |
926,462 |
1 |
2 |
0 |
305,808 |
33.01% |
66.50% |
33.50% |
0.00% |
0.00% |
616,135 |
310,327 |
0 |
0 |
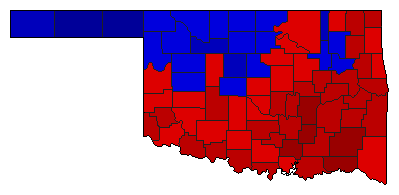
 | | Lt. Governor |
924,855 |
1 |
2 |
3 |
24,335 |
2.63% |
50.14% |
47.51% |
2.34% |
0.00% |
463,753 |
439,418 |
21,684 |
0 |
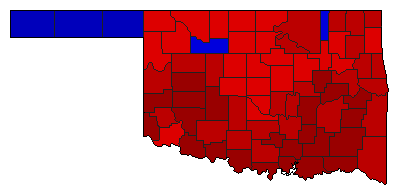 | | State Treasurer |
914,308 |
1 |
2 |
0 |
170,386 |
18.64% |
59.32% |
40.68% |
0.00% |
0.00% |
542,347 |
371,961 |
0 |
0 |
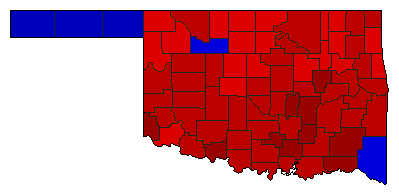 | | Attorney General |
920,631 |
1 |
2 |
0 |
206,097 |
22.39% |
61.19% |
38.81% |
0.00% |
0.00% |
563,364 |
357,267 |
0 |
0 |
 | | State Auditor |
908,089 |
1 |
2 |
0 |
30,533 |
3.36% |
51.68% |
48.32% |
0.00% |
0.00% |
469,311 |
438,778 |
0 |
0 |
 | | Insurance Commissioner |
911,302 |
1 |
2 |
0 |
37,140 |
4.08% |
52.04% |
47.96% |
0.00% |
0.00% |
474,221 |
437,081 |
0 |
0 |
| | | Map | Pie | Initiative | Total Vote | N | | Y | Margin | %Margin | No | | Yes | Oth. | No | | Yes | |
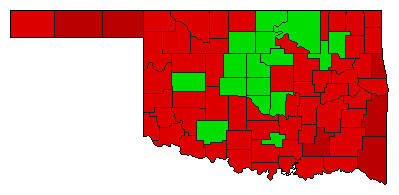 | | Referendum |
878,992 |
2 |
0 |
1 |
44,238 |
5.03% |
47.48% |
0.00% |
52.52% |
0.00% |
417,377 |
0 |
461,615 |
0 |
|
