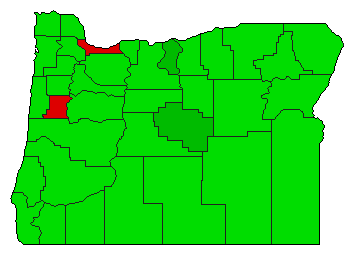
2006 General Election Results Comparison - Oregon
| Map | Pie | Office | Total | D | R | I | Margin | %Margin | Dem | Rep | Ind | Oth. | Dem | Rep | Ind | Other |
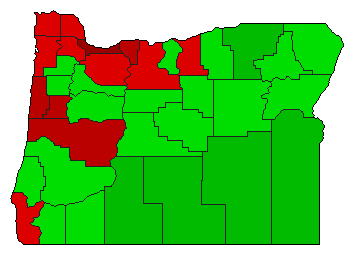
 |  | Governor | 1,379,475 | 1 | 2 | 0 | 110,038 | 7.98% | 50.73% | 42.75% | 0.00% | 6.52% | 699,786 | 589,748 | 0 | 89,941 |
| Map | Pie | Initiative | Total Vote | N | Y | Margin | %Margin | No | Yes | Oth. | No | Yes | ||||
 | Initiative | 1,363,482 | 1 | 0 | 2 | 129,730 | 9.51% | 54.76% | 0.00% | 45.24% | 0.00% | 746,606 | 0 | 616,876 | 0 | |
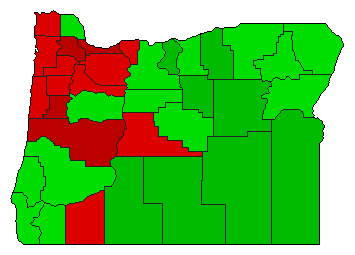 | Initiative | 1,325,557 | 1 | 0 | 2 | 173,251 | 13.07% | 56.54% | 0.00% | 43.46% | 0.00% | 749,404 | 0 | 576,153 | 0 | |
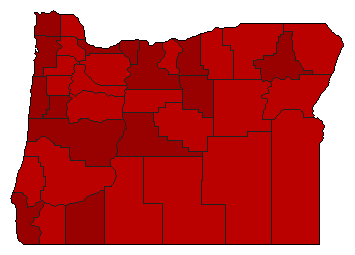 | Initiative | 1,303,600 | 1 | 0 | 2 | 543,658 | 41.70% | 70.85% | 0.00% | 29.15% | 0.00% | 923,629 | 0 | 379,971 | 0 | |
 | Initiative | 1,356,010 | 1 | 0 | 2 | 396,140 | 29.21% | 64.61% | 0.00% | 35.39% | 0.00% | 876,075 | 0 | 479,935 | 0 | |
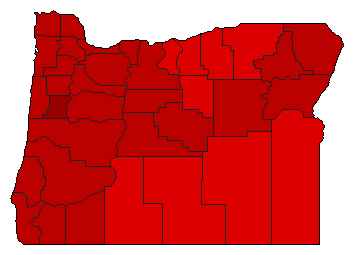
 | Initiative | 1,310,174 | 2 | 0 | 1 | 79,662 | 6.08% | 46.96% | 0.00% | 53.04% | 0.00% | 615,256 | 0 | 694,918 | 0 | |
Oregon Results for 2006
Login
© Dave Leip's Atlas of U.S. Elections, LLC 2019 All Rights Reserved
Note: The advertisement links below may advocate political positions that this site does not endorse.
Login
© Dave Leip's Atlas of U.S. Elections, LLC 2019 All Rights Reserved
Note: The advertisement links below may advocate political positions that this site does not endorse.