2006 General Election Results Comparison - Pennsylvania
| Map | Pie | Office | Total | D | R | I | Margin | %Margin | Dem | Rep | Ind | Oth. | Dem | Rep | Ind | Other |
 |  | Senator | 4,081,043 | 1 | 2 | 0 | 708,206 | 17.35% | 58.64% | 41.28% | 0.00% | 0.08% | 2,392,984 | 1,684,778 | 0 | 3,281 |
 |  | Governor | 4,096,077 | 1 | 2 | 0 | 848,382 | 20.71% | 60.31% | 39.60% | 0.00% | 0.08% | 2,470,517 | 1,622,135 | 0 | 3,425 |
| Map | Pie | Initiative | Total Vote | N | Y | Margin | %Margin | No | Yes | Oth. | No | Yes | ||||
 | Referendum | 3,391,743 | 2 | 0 | 1 | 757,641 | 22.34% | 38.83% | 0.00% | 61.17% | 0.00% | 1,317,051 | 0 | 2,074,692 | 0 | |
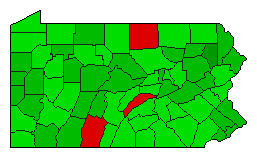
Pennsylvania Results for 2006
Login
© Dave Leip's Atlas of U.S. Elections, LLC 2019 All Rights Reserved
Note: The advertisement links below may advocate political positions that this site does not endorse.
Login
© Dave Leip's Atlas of U.S. Elections, LLC 2019 All Rights Reserved
Note: The advertisement links below may advocate political positions that this site does not endorse.