| Map | Pie | Office | Total | D | R | I | Margin | %Margin | Dem | Rep | Ind | Oth. | Dem | Rep | Ind | Other | | | | | | | | | | | | | | | | | | |
|---|
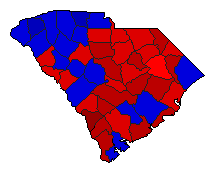
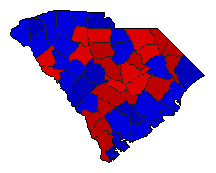
 |  | Governor |
1,091,952 |
2 |
1 |
0 |
112,792 |
10.33% |
44.79% |
55.12% |
0.00% |
0.09% |
489,076 |
601,868 |
0 |
1,008 |
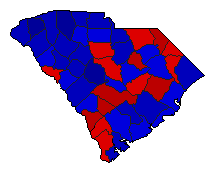
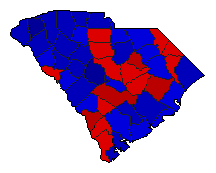
 | | Lt. Governor |
1,085,092 |
2 |
1 |
0 |
3,108 |
0.29% |
49.79% |
50.08% |
0.00% |
0.13% |
540,306 |
543,414 |
0 |
1,372 |
 | | Secretary of State |
1,072,342 |
2 |
1 |
0 |
241,450 |
22.52% |
38.72% |
61.24% |
0.00% |
0.04% |
415,211 |
656,661 |
0 |
470 |
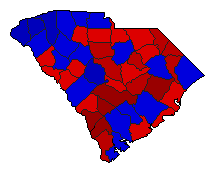 | | State Treasurer |
1,085,924 |
2 |
1 |
0 |
47,574 |
4.38% |
47.79% |
52.17% |
0.00% |
0.04% |
518,966 |
566,540 |
0 |
418 |
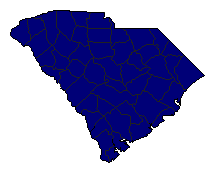 | | Attorney General |
785,546 |
0 |
1 |
0 |
773,360 |
98.45% |
0.00% |
99.22% |
0.00% |
0.78% |
0 |
779,453 |
0 |
6,093 |
 | | Comptroller General |
1,072,948 |
2 |
1 |
0 |
70,332 |
6.56% |
46.71% |
53.26% |
0.00% |
0.03% |
501,122 |
571,454 |
0 |
372 |
 |  | Agriculture Commissioner |
1,065,477 |
2 |
1 |
0 |
206,648 |
19.39% |
40.29% |
59.68% |
0.00% |
0.03% |
429,255 |
635,903 |
0 |
319 |
| | | Map | Pie | Initiative | Total Vote | N | | Y | Margin | %Margin | No | | Yes | Oth. | No | | Yes | |
 | | Referendum |
1,063,676 |
2 |
0 |
1 |
595,044 |
55.94% |
22.03% |
0.00% |
77.97% |
0.00% |
234,316 |
0 |
829,360 |
0 |
|
