| Map | Pie | Office | Total | D | R | I | Margin | %Margin | Dem | Rep | Ind | Oth. | Dem | Rep | Ind | Other | | | | | | | | | | | | | | | | | | |
|---|
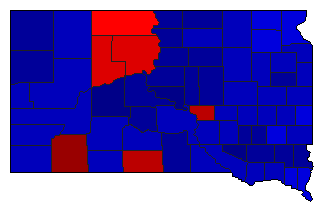
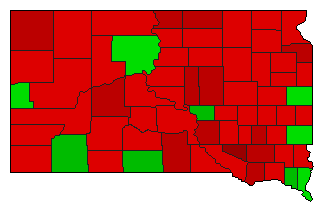
 |  | Governor |
335,508 |
2 |
1 |
0 |
85,764 |
25.56% |
36.13% |
61.69% |
0.00% |
2.17% |
121,226 |
206,990 |
0 |
7,292 |
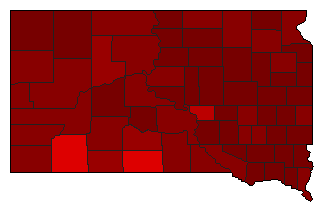
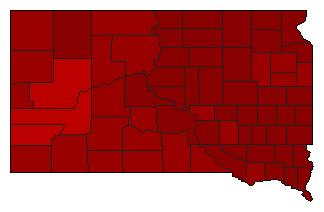
 | | Attorney General |
320,250 |
2 |
1 |
0 |
102,812 |
32.10% |
32.56% |
64.66% |
0.00% |
2.78% |
104,267 |
207,079 |
0 |
8,904 |
| | | Map | Pie | Initiative | Total Vote | N | | Y | Margin | %Margin | No | | Yes | Oth. | No | | Yes | |
 | | Referendum |
330,375 |
1 |
0 |
2 |
259,093 |
78.42% |
89.21% |
0.00% |
10.79% |
0.00% |
294,734 |
0 |
35,641 |
0 |
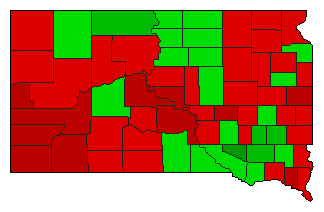 | | Initiative |
334,593 |
1 |
0 |
2 |
37,297 |
11.15% |
55.57% |
0.00% |
44.43% |
0.00% |
185,945 |
0 |
148,648 |
0 |
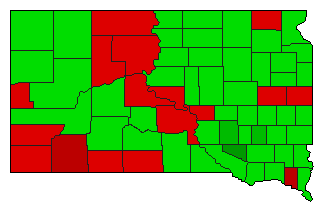 | | Initiative |
332,457 |
2 |
0 |
1 |
12,153 |
3.66% |
48.17% |
0.00% |
51.83% |
0.00% |
160,152 |
0 |
172,305 |
0 |
 | | Initiative |
331,131 |
1 |
0 |
2 |
15,225 |
4.60% |
52.30% |
0.00% |
47.70% |
0.00% |
173,178 |
0 |
157,953 |
0 |
 | | Initiative |
326,278 |
1 |
0 |
2 |
194,472 |
59.60% |
79.80% |
0.00% |
20.20% |
0.00% |
260,375 |
0 |
65,903 |
0 |
|
