| Map | Pie | Office | Total | D | R | I | Margin | %Margin | Dem | Rep | Ind | Oth. | Dem | Rep | Ind | Other | | | | | | | | | | | | | | | | | | |
|---|
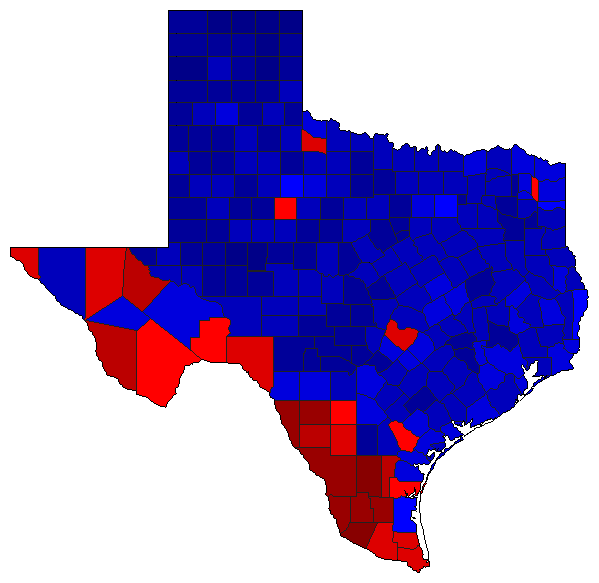
 |  | Senator |
4,314,663 |
2 |
1 |
0 |
1,106,587 |
25.65% |
36.04% |
61.69% |
0.00% |
2.26% |
1,555,202 |
2,661,789 |
0 |
97,672 |
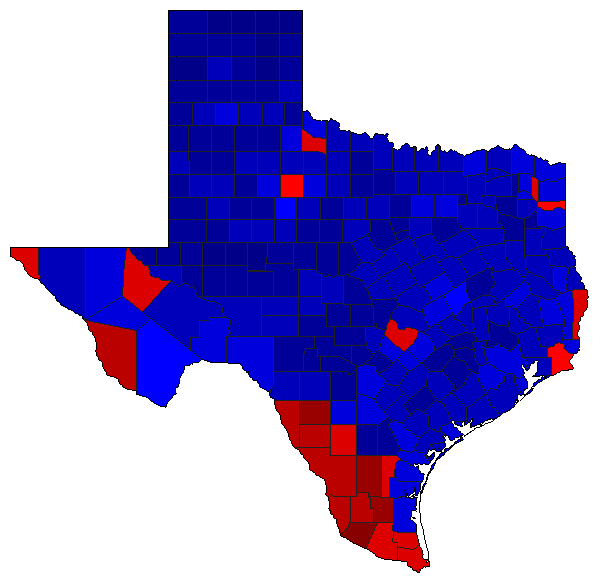
 |  | Governor |
4,399,068 |
2 |
1 |
3 |
406,450 |
9.24% |
29.79% |
39.03% |
18.13% |
13.06% |
1,310,353 |
1,716,803 |
797,577 |
574,335 |
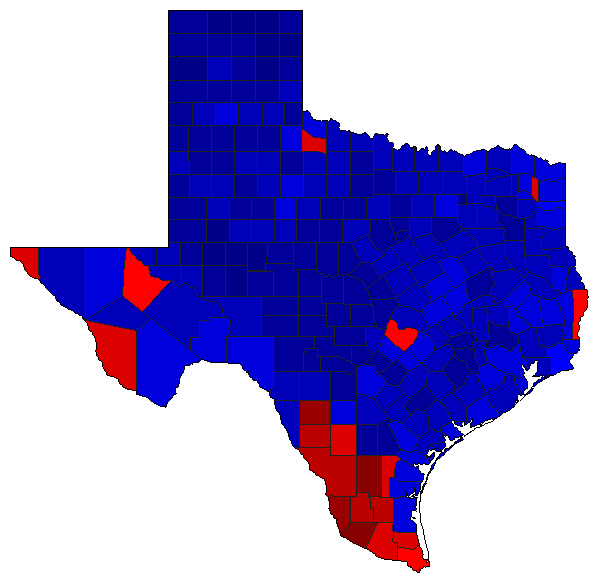
 | | Lt. Governor |
4,321,386 |
2 |
1 |
0 |
896,891 |
20.75% |
37.44% |
58.20% |
0.00% |
4.36% |
1,618,045 |
2,514,936 |
0 |
188,405 |
 | | Attorney General |
4,294,800 |
2 |
1 |
3 |
956,994 |
22.28% |
37.23% |
59.52% |
3.25% |
0.00% |
1,599,069 |
2,556,063 |
139,668 |
0 |
 | | Comptroller General |
4,283,250 |
2 |
1 |
0 |
961,961 |
22.46% |
37.01% |
59.47% |
0.00% |
3.52% |
1,585,362 |
2,547,323 |
0 |
150,565 |
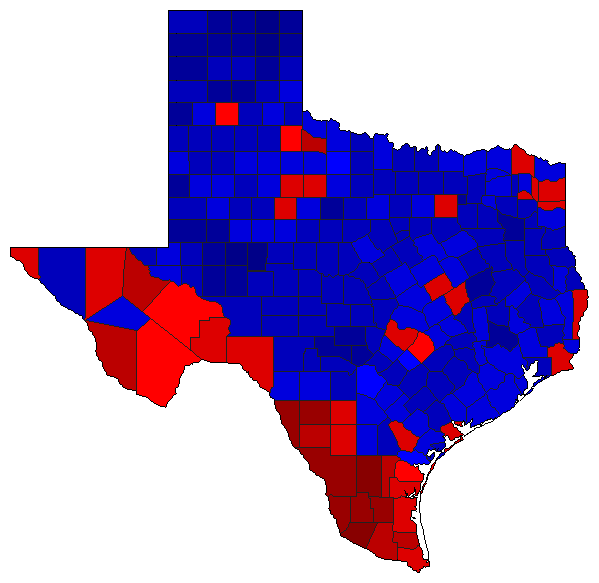 | | Agriculture Commissioner |
4,212,797 |
2 |
1 |
3 |
547,004 |
12.98% |
41.79% |
54.77% |
3.44% |
0.00% |
1,760,402 |
2,307,406 |
144,989 |
0 |
|
