2006 General Election Results Comparison - Washington
| Map | Pie | Office | Total | D | R | I | Margin | %Margin | Dem | Rep | Ind | Oth. | Dem | Rep | Ind | Other |
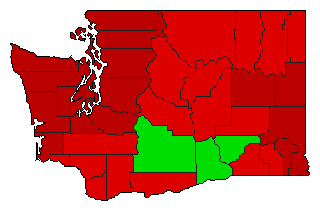
 |  | Senator | 2,085,179 | 1 | 2 | 5 | 352,553 | 16.91% | 56.81% | 39.91% | 0.79% | 2.50% | 1,184,659 | 832,106 | 16,384 | 52,030 |
| Map | Pie | Initiative | Total Vote | N | Y | Margin | %Margin | No | Yes | Oth. | No | Yes | ||||
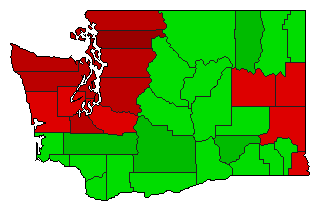
 | Initiative | 2,036,157 | 1 | 0 | 2 | 480,063 | 23.58% | 61.79% | 0.00% | 38.21% | 0.00% | 1,258,110 | 0 | 778,047 | 0 | |
 | Initiative | 2,039,671 | 1 | 0 | 2 | 359,687 | 17.63% | 58.82% | 0.00% | 41.18% | 0.00% | 1,199,679 | 0 | 839,992 | 0 | |
 | Initiative | 2,015,426 | 2 | 0 | 1 | 69,932 | 3.47% | 48.27% | 0.00% | 51.73% | 0.00% | 972,747 | 0 | 1,042,679 | 0 | |
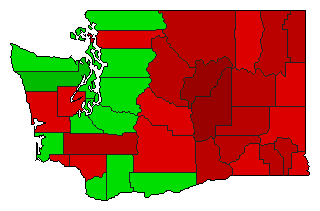 | Initiative | 2,015,426 | 2 | 0 | 1 | 69,932 | 3.47% | 48.27% | 0.00% | 51.73% | 0.00% | 972,747 | 0 | 1,042,679 | 0 | |
Washington Results for 2006
Login
© Dave Leip's Atlas of U.S. Elections, LLC 2019 All Rights Reserved
Note: The advertisement links below may advocate political positions that this site does not endorse.
Login
© Dave Leip's Atlas of U.S. Elections, LLC 2019 All Rights Reserved
Note: The advertisement links below may advocate political positions that this site does not endorse.