| Map | Pie | Office | Total | D | R | I | Margin | %Margin | Dem | Rep | Ind | Oth. | Dem | Rep | Ind | Other | | | | | | | | | | | | | | | | | | |
|---|
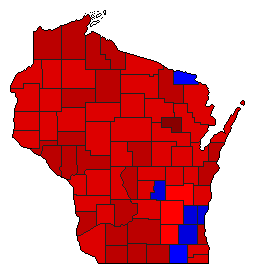
 |  | Senator |
2,138,297 |
1 |
2 |
4 |
808,915 |
37.83% |
67.31% |
29.48% |
1.17% |
2.04% |
1,439,214 |
630,299 |
25,096 |
43,688 |
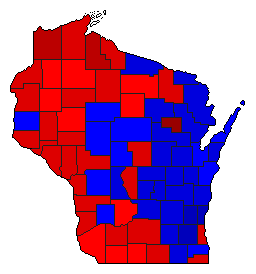
 |  | Governor |
2,161,700 |
1 |
2 |
0 |
159,688 |
7.39% |
52.70% |
45.31% |
0.00% |
2.00% |
1,139,115 |
979,427 |
0 |
43,158 |
 |  | Secretary of State |
2,075,405 |
1 |
2 |
0 |
388,034 |
18.70% |
57.08% |
38.39% |
0.00% |
4.53% |
1,184,720 |
796,686 |
0 |
93,999 |
 |  | State Treasurer |
2,051,865 |
1 |
2 |
0 |
9,389 |
0.46% |
47.35% |
46.89% |
0.00% |
5.75% |
971,598 |
962,209 |
0 |
118,058 |
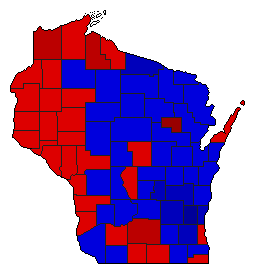 |  | Attorney General |
2,124,467 |
2 |
1 |
0 |
8,859 |
0.42% |
49.73% |
50.15% |
0.00% |
0.11% |
1,056,594 |
1,065,453 |
0 |
2,420 |
| | | Map | Pie | Initiative | Total Vote | N | | Y | Margin | %Margin | No | | Yes | Oth. | No | | Yes | |
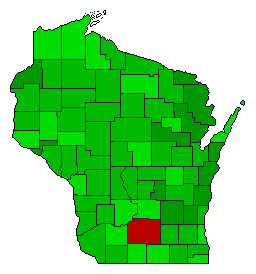 | | Referendum |
2,127,234 |
2 |
0 |
1 |
401,386 |
18.87% |
40.57% |
0.00% |
59.43% |
0.00% |
862,924 |
0 |
1,264,310 |
0 |
 | | Referendum |
2,101,079 |
2 |
0 |
1 |
232,063 |
11.04% |
44.48% |
0.00% |
55.52% |
0.00% |
934,508 |
0 |
1,166,571 |
0 |
|
