2006 General Election Results Comparison - Wyoming
| Map | Pie | Office | Total | D | R | I | Margin | %Margin | Dem | Rep | Ind | Oth. | Dem | Rep | Ind | Other |
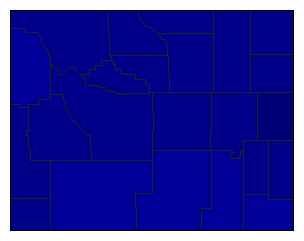
 |  | Senator | 193,136 | 2 | 1 | 0 | 77,503 | 40.13% | 29.86% | 69.99% | 0.00% | 0.15% | 57,671 | 135,174 | 0 | 291 |
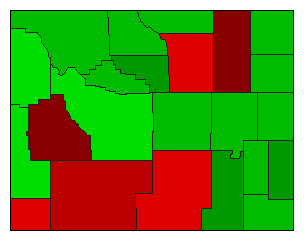
 |  | Governor | 193,892 | 1 | 2 | 0 | 77,416 | 39.93% | 69.89% | 29.97% | 0.00% | 0.14% | 135,516 | 58,100 | 0 | 276 |
 | Secretary of State | 181,359 | 0 | 1 | 0 | 115,659 | 63.77% | 0.00% | 81.72% | 0.00% | 18.28% | 0 | 148,210 | 0 | 33,149 | |
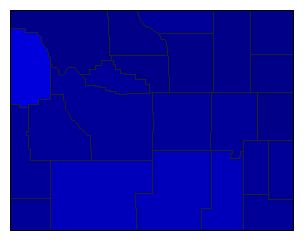 | State Treasurer | 185,397 | 2 | 1 | 0 | 84,247 | 45.44% | 27.28% | 72.72% | 0.00% | 0.00% | 50,575 | 134,822 | 0 | 0 | |
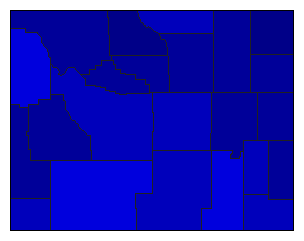 | State Auditor | 186,434 | 2 | 1 | 0 | 67,366 | 36.13% | 31.93% | 68.07% | 0.00% | 0.00% | 59,534 | 126,900 | 0 | 0 | |
| Map | Pie | Initiative | Total Vote | N | Y | Margin | %Margin | No | Yes | Oth. | No | Yes | ||||
 | Referendum | 184,819 | 2 | 0 | 1 | 30,143 | 16.31% | 41.85% | 0.00% | 58.15% | 0.00% | 77,338 | 0 | 107,481 | 0 | |
Wyoming Results for 2006
Login
© Dave Leip's Atlas of U.S. Elections, LLC 2019 All Rights Reserved
Note: The advertisement links below may advocate political positions that this site does not endorse.
Login
© Dave Leip's Atlas of U.S. Elections, LLC 2019 All Rights Reserved
Note: The advertisement links below may advocate political positions that this site does not endorse.