| Map | Pie | Office | Total | D | R | I | Margin | %Margin | Dem | Rep | Ind | Oth. | Dem | Rep | Ind | Other | | | | | | | | | | | | | | | | | | |
|---|
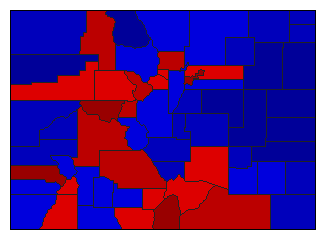
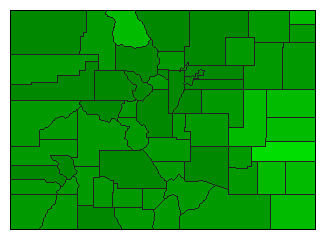
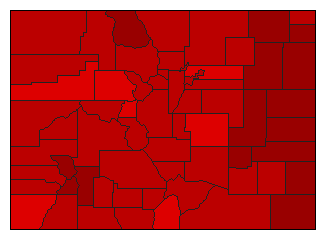
 |  | Governor |
1,558,387 |
1 |
2 |
4 |
262,210 |
16.83% |
56.99% |
40.16% |
0.71% |
2.14% |
888,096 |
625,886 |
10,996 |
33,409 |
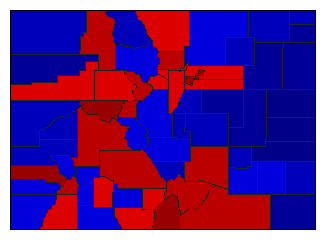
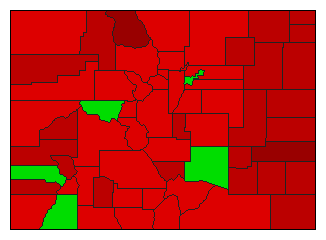
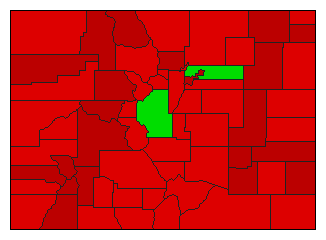
 | | Secretary of State |
1,520,935 |
2 |
1 |
0 |
23,871 |
1.57% |
49.22% |
50.78% |
0.00% |
0.00% |
748,532 |
772,403 |
0 |
0 |
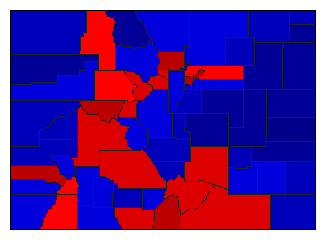
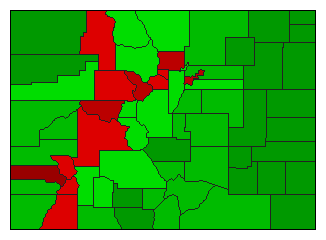
 | | State Treasurer |
1,501,121 |
1 |
2 |
0 |
39,685 |
2.64% |
51.32% |
48.68% |
0.00% |
0.00% |
770,403 |
730,718 |
0 |
0 |
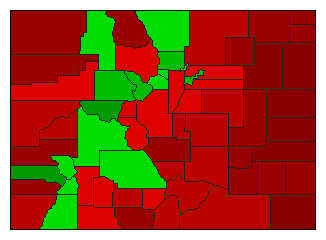
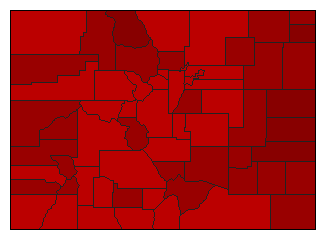
 | | Attorney General |
1,502,922 |
2 |
1 |
0 |
137,524 |
9.15% |
43.35% |
52.50% |
0.00% |
4.15% |
651,486 |
789,010 |
0 |
62,426 |
| | | Map | Pie | Initiative | Total Vote | N | | Y | Margin | %Margin | No | | Yes | Oth. | No | | Yes | |
 | | Referendum |
1,541,102 |
1 |
0 |
2 |
72,332 |
4.69% |
52.35% |
0.00% |
47.65% |
0.00% |
806,717 |
0 |
734,385 |
0 |
 | | Referendum |
1,509,199 |
2 |
0 |
1 |
882,615 |
58.48% |
20.76% |
0.00% |
79.24% |
0.00% |
313,292 |
0 |
1,195,907 |
0 |
 | | Referendum |
1,401,222 |
1 |
0 |
2 |
149,192 |
10.65% |
55.32% |
0.00% |
44.68% |
0.00% |
775,207 |
0 |
626,015 |
0 |
 | | Initiative |
1,554,156 |
2 |
0 |
1 |
156,096 |
10.04% |
44.98% |
0.00% |
55.02% |
0.00% |
699,030 |
0 |
855,126 |
0 |
 | | Initiative |
1,484,018 |
1 |
0 |
2 |
571,082 |
38.48% |
69.24% |
0.00% |
30.76% |
0.00% |
1,027,550 |
0 |
456,468 |
0 |
 | | Initiative |
1,514,218 |
1 |
0 |
2 |
375,252 |
24.78% |
62.39% |
0.00% |
37.61% |
0.00% |
944,735 |
0 |
569,483 |
0 |
 | | Initiative |
1,510,548 |
1 |
0 |
2 |
214,150 |
14.18% |
57.09% |
0.00% |
42.91% |
0.00% |
862,349 |
0 |
648,199 |
0 |
 | | Initiative |
1,550,349 |
1 |
0 |
2 |
276,473 |
17.83% |
58.92% |
0.00% |
41.08% |
0.00% |
913,411 |
0 |
636,938 |
0 |
 | | Initiative |
1,545,056 |
2 |
0 |
1 |
101,996 |
6.60% |
46.70% |
0.00% |
53.30% |
0.00% |
721,530 |
0 |
823,526 |
0 |
 | | Initiative |
1,500,534 |
2 |
0 |
1 |
377,242 |
25.14% |
37.43% |
0.00% |
62.57% |
0.00% |
561,646 |
0 |
938,888 |
0 |
|
