Note: The Google advertisement links below may advocate political positions that this site does not endorse.
| Map | Pie | Year | Total | D | R | I | Margin | %Margin | Dem | Rep | Ind | Oth. | Dem | Rep | Ind | Other | | | | | | | | | | | | | | | | | | |
|---|
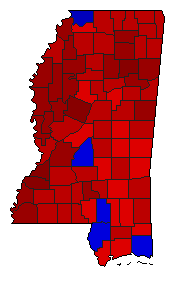
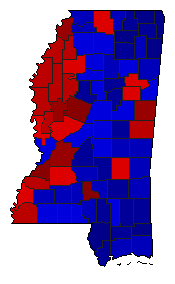 |  | 2019 |
877,536 |
2 |
1 |
0 |
137,400 |
15.66% |
42.17% |
57.83% |
0.00% |
0.00% |
370,068 |
507,468 |
0 |
0 |
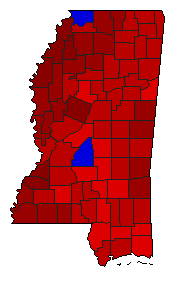
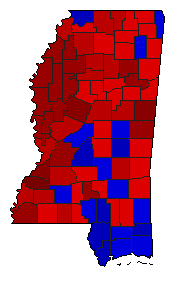 |  | 2015 |
716,161 |
1 |
2 |
0 |
75,777 |
10.58% |
55.29% |
44.71% |
0.00% |
0.00% |
395,969 |
320,192 |
0 |
0 |
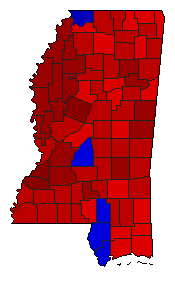 | | 2011 |
879,524 |
1 |
2 |
0 |
193,738 |
22.03% |
61.01% |
38.99% |
0.00% |
0.00% |
536,631 |
342,893 |
0 |
0 |
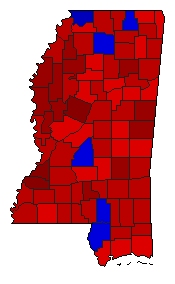 | | 2007 |
735,533 |
1 |
2 |
0 |
144,501 |
19.65% |
59.82% |
40.18% |
0.00% |
0.00% |
440,017 |
295,516 |
0 |
0 |
 | | 2003 |
873,988 |
1 |
2 |
0 |
222,104 |
25.41% |
62.71% |
37.29% |
0.00% |
0.00% |
548,046 |
325,942 |
0 |
0 |
 | | 1999 |
749,017 |
1 |
2 |
0 |
203,213 |
27.13% |
63.57% |
36.43% |
0.00% |
0.00% |
476,115 |
272,902 |
0 |
0 |
|
