| Map | Pie | Office | Total | D | R | I | Margin | %Margin | Dem | Rep | Ind | Oth. | Dem | Rep | Ind | Other | | | | | | | | | | | | | | | | | | |
|---|
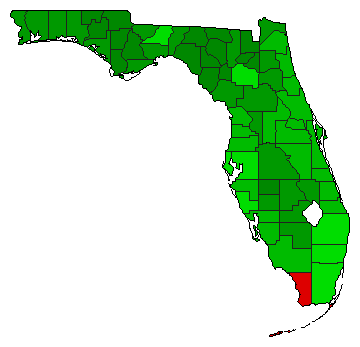
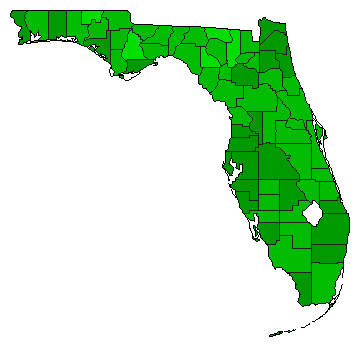
 |  | President |
8,412,248 |
1 |
2 |
- |
236,148 |
2.81% |
50.91% |
48.10% |
0.00% |
0.99% |
4,282,367 |
4,046,219 |
0 |
83,662 |
| | | Map | Pie | Initiative | Total Vote | N | | Y | Margin | %Margin | No | | Yes | Oth. | No | | Yes | |
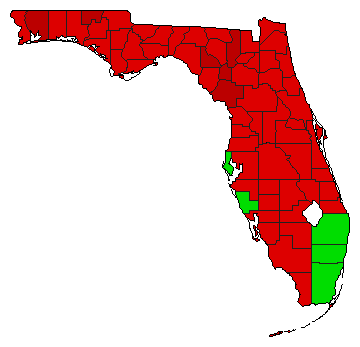
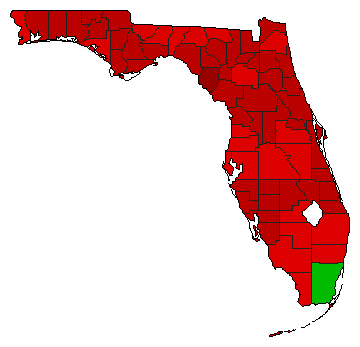
 | | Referendum |
7,898,909 |
2 |
0 |
1 |
1,882,857 |
23.84% |
38.08% |
0.00% |
61.92% |
0.00% |
3,008,026 |
0 |
4,890,883 |
0 |
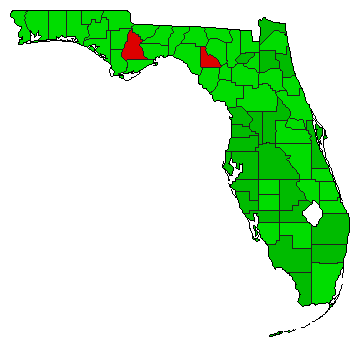
 | | Referendum |
7,435,794 |
1 |
0 |
2 |
307,614 |
4.14% |
52.07% |
0.00% |
47.93% |
0.00% |
3,871,704 |
0 |
3,564,090 |
0 |
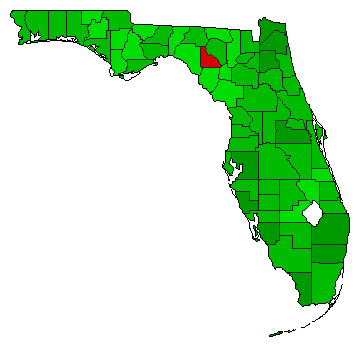
 | | Referendum |
7,191,800 |
2 |
0 |
1 |
1,512,150 |
21.03% |
39.49% |
0.00% |
60.51% |
0.00% |
2,839,825 |
0 |
4,351,975 |
0 |
 | | Referendum |
7,111,131 |
2 |
0 |
1 |
2,639,193 |
37.11% |
31.44% |
0.00% |
68.56% |
0.00% |
2,235,969 |
0 |
4,875,162 |
0 |
 | | Referendum |
7,055,354 |
2 |
0 |
1 |
2,911,272 |
41.26% |
29.37% |
0.00% |
70.63% |
0.00% |
2,072,041 |
0 |
4,983,313 |
0 |
 | | Referendum |
7,372,212 |
1 |
0 |
2 |
951,250 |
12.90% |
56.45% |
0.00% |
43.55% |
0.00% |
4,161,731 |
0 |
3,210,481 |
0 |
|
