| Map | Pie | Office | Total | D | R | I | Margin | %Margin | Dem | Rep | Ind | Oth. | Dem | Rep | Ind | Other | | | | | | | | | | | | | | | | | | |
|---|
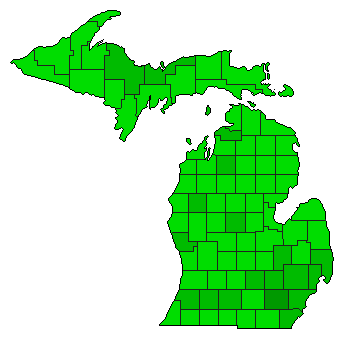
 |  | President |
5,010,606 |
1 |
2 |
- |
823,940 |
16.44% |
57.33% |
40.89% |
0.00% |
1.78% |
2,872,579 |
2,048,639 |
0 |
89,388 |
 |  | Senator |
4,848,620 |
1 |
2 |
0 |
1,397,316 |
28.82% |
62.66% |
33.85% |
0.00% |
3.49% |
3,038,386 |
1,641,070 |
0 |
169,164 |
| | | Map | Pie | Initiative | Total Vote | N | | Y | Margin | %Margin | No | | Yes | Oth. | No | | Yes | |
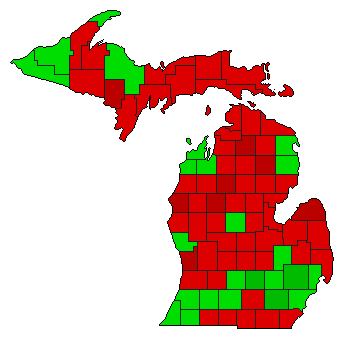
 | | Initiative |
4,797,709 |
2 |
0 |
1 |
1,215,931 |
25.34% |
37.33% |
0.00% |
62.67% |
0.00% |
1,790,889 |
0 |
3,006,820 |
0 |
 | | Initiative |
4,792,109 |
2 |
0 |
1 |
249,943 |
5.22% |
47.39% |
0.00% |
52.61% |
0.00% |
2,271,083 |
0 |
2,521,026 |
0 |
|
