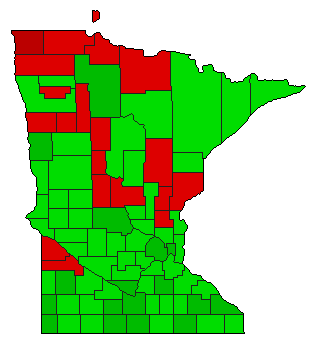
2008 General Election Results Comparison - Minnesota
| Map | Pie | Office | Total | D | R | I | Margin | %Margin | Dem | Rep | Ind | Oth. | Dem | Rep | Ind | Other |
 |  | President | 2,910,369 | 1 | 2 | - | 297,945 | 10.24% | 54.06% | 43.82% | 0.00% | 2.12% | 1,573,354 | 1,275,409 | 0 | 61,606 |
 |  | Senator | 2,887,646 | 1 | 2 | 3 | 312 | 0.01% | 41.99% | 41.98% | 15.15% | 0.87% | 1,212,629 | 1,212,317 | 437,505 | 25,195 |
| Map | Pie | Initiative | Total Vote | N | Y | Margin | %Margin | No | Yes | Oth. | No | Yes | ||||
 | Referendum | 2,776,561 | 2 | 0 | 1 | 493,481 | 17.77% | 41.11% | 0.00% | 58.89% | 0.00% | 1,141,540 | 0 | 1,635,021 | 0 | |
Minnesota Results for 2008
Login
© Dave Leip's Atlas of U.S. Elections, LLC 2019 All Rights Reserved
Note: The advertisement links below may advocate political positions that this site does not endorse.
Login
© Dave Leip's Atlas of U.S. Elections, LLC 2019 All Rights Reserved
Note: The advertisement links below may advocate political positions that this site does not endorse.