2008 General Election Results Comparison - Montana
| Map | Pie | Office | Total | D | R | I | Margin | %Margin | Dem | Rep | Ind | Oth. | Dem | Rep | Ind | Other |
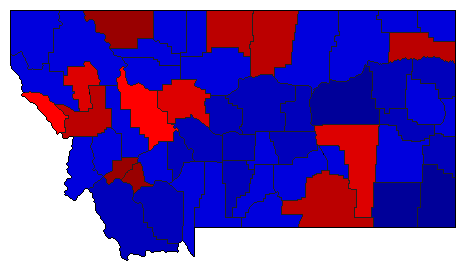
 |  | President | 492,750 | 2 | 1 | - | 11,723 | 2.38% | 47.11% | 49.49% | 0.00% | 3.39% | 232,159 | 243,882 | 0 | 16,709 |
 |  | Senator | 479,366 | 1 | 2 | 0 | 219,422 | 45.77% | 72.89% | 27.11% | 0.00% | 0.00% | 349,394 | 129,972 | 0 | 0 |
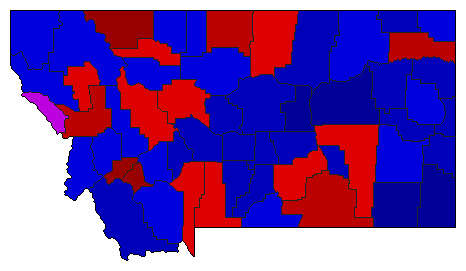
 |  | Governor | 488,566 | 1 | 2 | 0 | 160,625 | 32.88% | 65.42% | 32.54% | 0.00% | 2.03% | 319,625 | 159,000 | 0 | 9,941 |
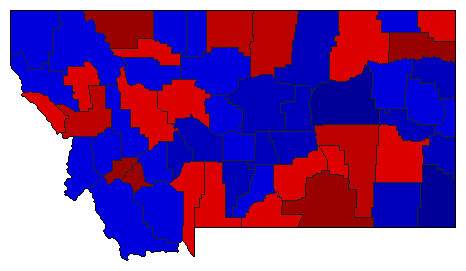
 | Secretary of State | 473,851 | 1 | 2 | 0 | 5,305 | 1.12% | 49.32% | 48.20% | 0.00% | 2.47% | 233,717 | 228,412 | 0 | 11,722 | |
 | Attorney General | 464,111 | 1 | 2 | 0 | 23,193 | 5.00% | 52.50% | 47.50% | 0.00% | 0.00% | 243,652 | 220,459 | 0 | 0 | |
 | State Auditor | 458,294 | 1 | 2 | 0 | 31,326 | 6.84% | 53.42% | 46.58% | 0.00% | 0.00% | 244,810 | 213,484 | 0 | 0 |
Montana Results for 2008
Login
© Dave Leip's Atlas of U.S. Elections, LLC 2019 All Rights Reserved
Note: The advertisement links below may advocate political positions that this site does not endorse.
Login
© Dave Leip's Atlas of U.S. Elections, LLC 2019 All Rights Reserved
Note: The advertisement links below may advocate political positions that this site does not endorse.