| Map | Pie | Office | Total | D | R | I | Margin | %Margin | Dem | Rep | Ind | Oth. | Dem | Rep | Ind | Other | | | | | | | | | | | | | | | | | | |
|---|
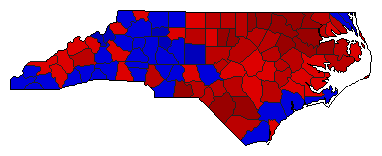
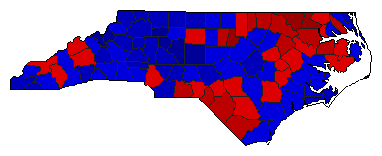
 |  | President |
4,310,789 |
1 |
2 |
- |
14,177 |
0.33% |
49.70% |
49.38% |
0.00% |
0.92% |
2,142,651 |
2,128,474 |
0 |
39,664 |
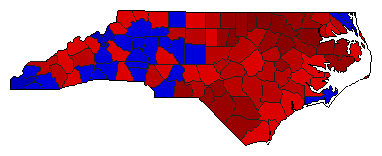
 |  | Senator |
4,271,970 |
1 |
2 |
0 |
361,801 |
8.47% |
52.65% |
44.18% |
0.00% |
3.16% |
2,249,311 |
1,887,510 |
0 |
135,149 |
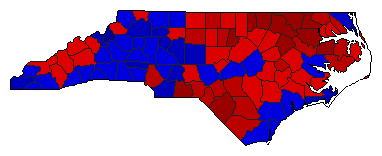
 |  | Governor |
4,268,941 |
1 |
2 |
0 |
145,021 |
3.40% |
50.27% |
46.88% |
0.00% |
2.85% |
2,146,189 |
2,001,168 |
0 |
121,584 |
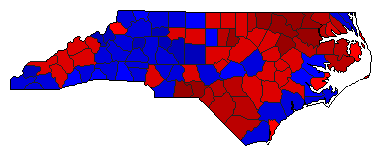
 | | Lt. Governor |
4,173,985 |
1 |
2 |
3 |
218,029 |
5.22% |
51.10% |
45.88% |
3.02% |
0.00% |
2,132,970 |
1,914,941 |
126,074 |
0 |
 | | Secretary of State |
4,079,814 |
1 |
2 |
0 |
553,976 |
13.58% |
56.79% |
43.21% |
0.00% |
0.00% |
2,316,895 |
1,762,919 |
0 |
0 |
 | | State Treasurer |
4,065,351 |
1 |
2 |
0 |
293,937 |
7.23% |
53.62% |
46.38% |
0.00% |
0.00% |
2,179,644 |
1,885,707 |
0 |
0 |
 | | Attorney General |
4,153,783 |
1 |
2 |
0 |
922,347 |
22.20% |
61.10% |
38.90% |
0.00% |
0.00% |
2,538,065 |
1,615,718 |
0 |
0 |
 | | State Auditor |
4,060,455 |
1 |
2 |
0 |
290,015 |
7.14% |
53.57% |
46.43% |
0.00% |
0.00% |
2,175,235 |
1,885,220 |
0 |
0 |
 | | Insurance Commissioner |
4,085,197 |
1 |
2 |
0 |
284,418 |
6.96% |
51.57% |
44.61% |
0.00% |
3.82% |
2,106,870 |
1,822,452 |
0 |
155,875 |
 | | Agriculture Commissioner |
4,092,887 |
2 |
1 |
0 |
167,405 |
4.09% |
47.95% |
52.05% |
0.00% |
0.00% |
1,962,741 |
2,130,146 |
0 |
0 |
|
