| Map | Pie | Office | Total | D | R | I | Margin | %Margin | Dem | Rep | Ind | Oth. | Dem | Rep | Ind | Other | | | | | | | | | | | | | | | | | | |
|---|
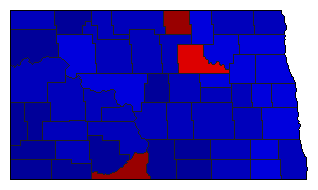
 |  | President |
317,738 |
2 |
1 |
- |
27,484 |
8.65% |
44.50% |
53.15% |
0.00% |
2.34% |
141,403 |
168,887 |
0 |
7,448 |
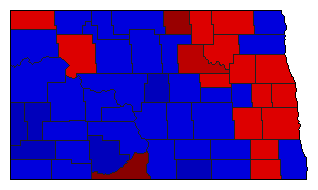
 |  | Governor |
315,692 |
2 |
1 |
0 |
160,730 |
50.91% |
23.53% |
74.44% |
0.00% |
2.03% |
74,279 |
235,009 |
0 |
6,404 |
 | | State Treasurer |
294,251 |
2 |
1 |
0 |
67,405 |
22.91% |
38.55% |
61.45% |
0.00% |
0.00% |
113,423 |
180,828 |
0 |
0 |
 | | State Auditor |
296,166 |
2 |
1 |
0 |
63,628 |
21.48% |
39.26% |
60.74% |
0.00% |
0.00% |
116,269 |
179,897 |
0 |
0 |
 | | Insurance Commissioner |
300,205 |
2 |
1 |
0 |
1,833 |
0.61% |
49.69% |
50.31% |
0.00% |
0.00% |
149,186 |
151,019 |
0 |
0 |
| | | Map | Pie | Initiative | Total Vote | N | | Y | Margin | %Margin | No | | Yes | Oth. | No | | Yes | |
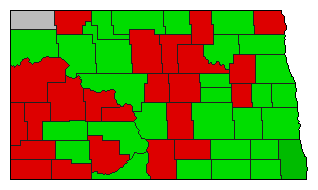 | | Referendum |
301,786 |
2 |
0 |
1 |
23,762 |
7.87% |
46.06% |
0.00% |
53.94% |
0.00% |
139,012 |
0 |
162,774 |
0 |
|
