2008 General Election Results Comparison - West Virginia
| Map | Pie | Office | Total | D | R | I | Margin | %Margin | Dem | Rep | Ind | Oth. | Dem | Rep | Ind | Other |
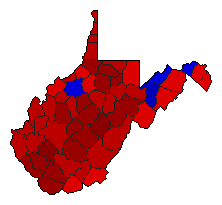
 |  | President | 715,123 | 2 | 1 | - | 93,609 | 13.09% | 42.49% | 55.58% | 0.00% | 1.93% | 303,857 | 397,466 | 0 | 13,800 |
 |  | Senator | 702,308 | 1 | 2 | 0 | 192,931 | 27.47% | 63.73% | 36.26% | 0.00% | 0.02% | 447,560 | 254,629 | 0 | 119 |
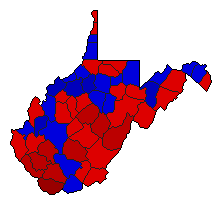
 |  | Governor | 706,046 | 1 | 2 | 0 | 311,085 | 44.06% | 69.78% | 25.72% | 0.00% | 4.50% | 492,697 | 181,612 | 0 | 31,737 |
 | Secretary of State | 667,713 | 1 | 2 | 0 | 207,147 | 31.02% | 65.51% | 34.49% | 0.00% | 0.00% | 437,430 | 230,283 | 0 | 0 | |
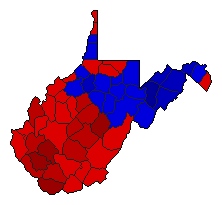
 | Attorney General | 678,710 | 1 | 2 | 0 | 5,312 | 0.78% | 50.39% | 49.61% | 0.00% | 0.00% | 342,011 | 336,699 | 0 | 0 | |
 | Agriculture Commissioner | 663,738 | 1 | 2 | 0 | 40,746 | 6.14% | 53.07% | 46.93% | 0.00% | 0.00% | 352,242 | 311,496 | 0 | 0 |
West Virginia Results for 2008
Login
© Dave Leip's Atlas of U.S. Elections, LLC 2019 All Rights Reserved
Note: The advertisement links below may advocate political positions that this site does not endorse.
Login
© Dave Leip's Atlas of U.S. Elections, LLC 2019 All Rights Reserved
Note: The advertisement links below may advocate political positions that this site does not endorse.