Note: The Google advertisement links below may advocate political positions that this site does not endorse.
| Map | Pie | Office | Total | D | R | I | Margin | %Margin | Dem | Rep | Ind | Oth. | Dem | Rep | Ind | Other | | | | | | | | | | | | | | | | | | |
|---|
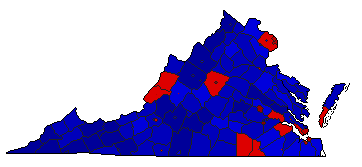
 |  | Governor |
1,984,934 |
2 |
1 |
0 |
344,614 |
17.36% |
41.26% |
58.62% |
0.00% |
0.13% |
818,909 |
1,163,523 |
0 |
2,502 |
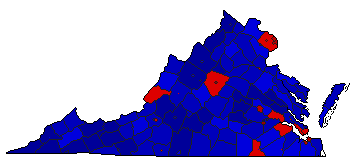
 | | Lt. Governor |
1,958,303 |
2 |
1 |
0 |
256,602 |
13.10% |
43.41% |
56.51% |
0.00% |
0.08% |
850,066 |
1,106,668 |
0 |
1,569 |
 | | Attorney General |
1,954,596 |
2 |
1 |
0 |
295,450 |
15.12% |
42.40% |
57.51% |
0.00% |
0.09% |
828,687 |
1,124,137 |
0 |
1,772 |
|
